[Report 1929] / Medical Officer of Health, Tynemouth County Borough.
- Tynemouth (England). County Borough Council.
- Date:
- 1929
Licence: Attribution 4.0 International (CC BY 4.0)
Credit: [Report 1929] / Medical Officer of Health, Tynemouth County Borough. Source: Wellcome Collection.
11/56 (page 9)
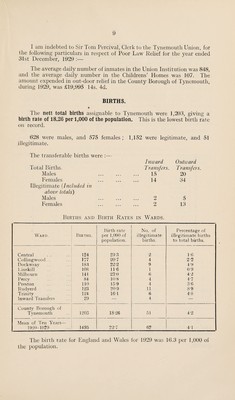
![I am indebted to Sir Tom Percival, Clerk to the Tynemouth Union, for the following particulars in respect of Poor Law Relief for the year ended 31st December, 1929 :— The average daily number of inmates in the Union Institution was 848, and the average daily number in the Childrens’ Homes was 107. The amount expended in out-door relief in the County Borough of Tynemouth, during 1929, was £19,995 14s. 4d. BIRTHS. The nett total births assignable to Tynemouth were 1,203, giving a birth rate of 18.26 per 1,000 of the population. This is the lowest birth rate on record. 628 were males, and 575 females ; 1,152 were legitimate, and 51 illegitimate. The transferable births were : Total Births. Males Females Illegitimate {Included in above totals) Males Females Inward Transfers. 15 14 Outward Transfers. 20 34 2 5 2 13 Births and Birth Rates in Wards. Ward. Births. Birth rate per 1,000 of population. No. of illegitimate births. Percentage of illegitimate births to total births. Central 124 23-3 2 1-6 Collingwood ... 177 20-7 4 2-2 Dockwray m 22-2 9 4-M Linskill 108 11-6 1 0-9 Milbourn 141 23-0 6 4-2 Percy 84 10-8 4 4-7 Preston 110 15 9 4 3-0 Rudyerd 123 20-9 11 8-9 Trinity 124 16T 6 4-8 Inward TTansfers 29 -- 4 _ County Rorough of Tynemouth 1203 18-26 51 4-2 Mean of 'I'en Years— ]T2()-H)29 1495 22-7 62 4-1 The birth rate for England and Wales lor 1929 was 16.3 per 1,000 of the population.](https://iiif.wellcomecollection.org/image/b30198859_0011.jp2/full/800%2C/0/default.jpg)