Statistics of inoculations with Haffkine's anti-plague vaccine, 1897-1900 : compiled from records in the Plague Department of the Secretariat and the Plague Research Laboratory, Bombay / by W. B. Bannerman.
- William Burney Bannerman
- Date:
- 1900
Licence: In copyright
Credit: Statistics of inoculations with Haffkine's anti-plague vaccine, 1897-1900 : compiled from records in the Plague Department of the Secretariat and the Plague Research Laboratory, Bombay / by W. B. Bannerman. Source: Wellcome Collection.
Provider: This material has been provided by Royal College of Physicians, London. The original may be consulted at Royal College of Physicians, London.
16/42 page 12
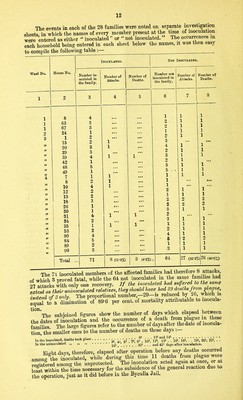
![The events in each of the 28 families were noted on separate investigation sheets, in which the names of every member present at the time of inoculation were entered as either “ inoculated ” or “ not inoculated. The occurrences m each household being entered in each sheet helow the names, it was then easy to compile the following table : ■ __ Inoculated. Not Ward No. House No. Number in- oculated in the family. Number of Attacks. Number of Deaths. Number not inoculated in the family. 1 2 3 4 5 6 1 8 4 1 2 1 63 3 ... ... 1 67 3 ... ... 2 ] 2 24 1 ... ... 3 1 2 • • • • •• 2 15 2 1 • • • 3 99 20 3 1 • • • 4 99 29 3 • •• ... 2 99 39 4 1 1 3 99 42 1 • • • ... 2 99 48 5 ... 3 99 49 1 • •• ... 5 • 99 4 7 1 1 • • • 1 8 2 1 • • • 1 j) 10 4 1 ... 1 99 12 2 • • • • • • 2 *■ 99 13 2 • • • • • • 1 99 18 3 ... 2 99 26 1 • • • • • • 2 r9 30 1 ... 3 99 99 31 34 4 2 1 1 • •• 2 3 99 35 1 1 1 1 » 53 2 • • • • • • 2 )) 80 4 • • • • • • 4 V 84 5 • •• ... 5 99 89 2 • •• • • • 1 99 90 3 • . . ... 3 99 Total .. 71 8 (11-3%) 3 (4-2%) 64 Not Inoculated. Number of Attacks. Number of' Deaths. 1 1 1 1 1 1 1 1 1 1 1 1 1 1 1 1 1 1 1 1 1 1 1 1 1 2 2 1 1 1 1 1 2 1 1 27 (42-2%) 26 (40-6%) The 71 inoculated members of the affected families had therefore 8 attacks, nf which 3 proved fatal, while the 64 not inoculated in the same families a 27Attacks with only one recovery. If the inoculated had suffered to the same extent as their uninoculated relatives, they should have had29 deaths from Zstead of 3 only. The proportional number-29-is reduced by 26 which is equal to a diminution of 89-6 per cent, of mortality attributable to mocula- tl0n*The subjoined figures show the number of days which elapsed between the dates of inoculation and the occurrence of a death from plague in these families. The large figures refer to the number of days after the date of inocula- tion, the smaller ones to the number of deaths on those days In the inoculated, deaths took place j,- ^ gj ' £,* g;? , iQV n», 15* * 16‘,'. ’. *39l, 20', 211, . . In the uninoculated ,, ,, » 241 321 . . . and 421 days after inoculation. Eight days, therefore, elapsed after operation before any deaths occurred amonggthe inoculated, while during this time ll deaths from plague were vftD-istered amon°> the unprotected. The inoculation acted again at once, or at least within the time necessary for the subsidence of the general reaction due to the operation, just as it did before in the Byculla Jail.](https://iiif.wellcomecollection.org/image/b28408329_0016.jp2/full/800%2C/0/default.jpg)