The etiology of osseous deformities of the head, face, jaws and teeth.
- Eugene Solomon Talbot
- Date:
- 1894
Licence: Public Domain Mark
Credit: The etiology of osseous deformities of the head, face, jaws and teeth. Source: Wellcome Collection.
Provider: This material has been provided by the Augustus C. Long Health Sciences Library at Columbia University and Columbia University Libraries/Information Services, through the Medical Heritage Library. The original may be consulted at the the Augustus C. Long Health Sciences Library at Columbia University and Columbia University.
82/572 page 62
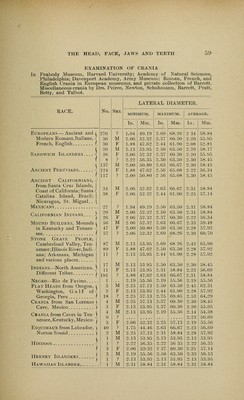
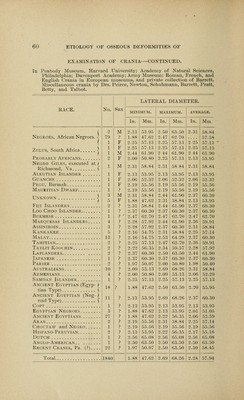
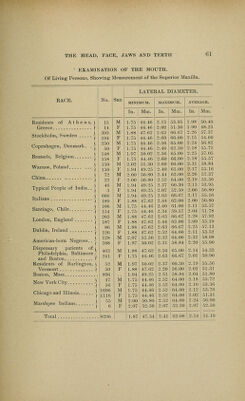
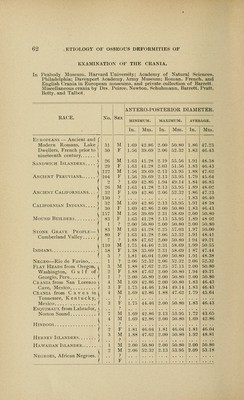
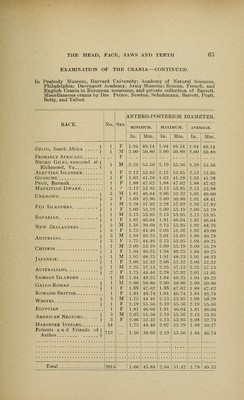
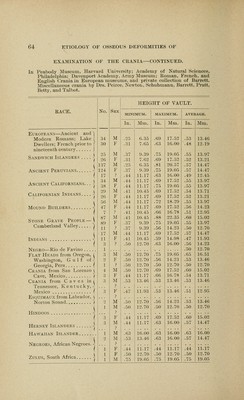
![EXAMINATION OF THE CRANIA. In Peabody Museum, Harvard University; Academy of Natural Sciences, Philadelphia; Davenport Academy, Army Museum; Roman, French, and English Crania in European museums, and private collection of Barrett. Miscellaneous crania by Drs. Peirce. Newton, Schuhmann. Barrett, Pratt. Betty, and Talbot. No. Sex ANTERO-POSTERIOR DIAMETER. RACE. MINIMUM, maximum. aveeage. In, Mm. In, Mm. In, Mm, Eltropeans — Ancient and f Modern Romans, Lake J .31 M 1.69 43.86 3.00 .50.80 1.86 47,33 Dwellers, French prior to | .30 F 1.56 39.69 3.06 53.32 1.83 46.43 nineteenth century I Sandwich Islanders - 26 39 M F 1.63 1.63 41.38 41.38 2.19 2.03 55.56 51.56 1.91 1.83 48.38 46.43 ( 123 M 1.56 39.69 2.13 53.95 1.88 47.62 Ancient Peruvians ■{ 104 F 1.56 39.69 3.13 53.95 1.79 45.64 I 2 ? 1.69 43.86 1.94 49.14 1.84 46.83 ( 26 M 1.63 41.38 3.13 53.95 1.89 48.03 Ancient Californians. .. -I 33 130 32 30 F ? M F 1.69 43.86 3.06 53.33 1.86 1.83 1.91 1.83 47,23 46,40 Californian Indians - 1.69 1.69 42.86 43.86 3.13 3.00 53.95 50.80 48 38 46.43 I 1.57 M 1.56 39.69 3.31 58.69 3.00 .50.80 Mound Builders - 83 F 1.63 41.38 3.13 53.95 1.89 48 02 1 1 ? 3.00 .50.80 3.00 .50.80 3.00 ,50,80 Stone Grave People—\ Cumberland Valley j 83 80 7 M F ? 1,63 1,63 1.88 41,38 41.28 47.62 3.35 3.06 3.00 57,03 53.32 50.80 1.97 1.91 1 94 .50.00 48.41 49.21 ( 110 M 1,75 44,46 3.31 58.69 1.99 50.55 Indians - .58 F 1.38 35.09 2.31 58.69 1 87 47.44 l 3 ? 1,81 46.04 2,00 ,50.80 1.91 48.38 Negro—Rio de Favino. , ,. . 1 9 3.06 53.33 2,06 52.33 3.06 52.32 Flat Heads from Oregon, i 3 M 1.88 47.63 2.35 57.13 3.00 50.80 Washington, Gulf of -| o f 1.88 47.63 3.00 .50.80 1.94 49.21 Georgio, Peru ( 1 4 ? M 3.00 1.69 .50.80 42.86 3.00 2.00 50.80 50.80 2.00 1.83 50.80 Crania from San Lorenzo \ 46.43 Cave, Mexico ( 3 4 F M 1.75 1.69 44.46 42.86 1.94 1.88 49.14 47.63 1.83 1.79 46.43 CkANiA from Caves in ( 45.64 Tennessee, Kentucky, -| Mexico ( 3 ? F 1.75 44.46 2.00 ,50.80 1.83 46.43 Esquimaux from Labrador, j Norton Sound ( 7 4 ? M M 1.69 1.69 42.86 42.86 2.13 2.00 53.95 50.80 1.72 1.69 43.65 \ 42.86 Hindoos -l ■? o F 1.81 46.04 1.81 46.04 1.81 46.04 Herney Islanders ■] 3 M ■? 1.88 47.62 3,00 50.80 1.92 48,81 Hawaiian Islander 1 M 3.00 .50.80 2,00 50.80 2.00 50.80 ( o M 3.06 53.33 2,13 53.95 2.09 53.18 Negroes, African Negroes. - ? F](https://iiif.wellcomecollection.org/image/b21206089_0082.jp2/full/800%2C/0/default.jpg)
 No text description is available for this image
 No text description is available for this image
 No text description is available for this image