Moisture and dryness, or, The analysis of atmospheric humidities in the United States / an essay read before the American climatological association (1884), and including the presentation of a rule of moisture and dryness, together with seasonal cloudiness and absolute humidity signal service charts.
- Charles Denison
- Date:
- 1885
Licence: Public Domain Mark
Credit: Moisture and dryness, or, The analysis of atmospheric humidities in the United States / an essay read before the American climatological association (1884), and including the presentation of a rule of moisture and dryness, together with seasonal cloudiness and absolute humidity signal service charts. Source: Wellcome Collection.
Provider: This material has been provided by the Augustus C. Long Health Sciences Library at Columbia University and Columbia University Libraries/Information Services, through the Medical Heritage Library. The original may be consulted at the the Augustus C. Long Health Sciences Library at Columbia University and Columbia University.
62/74 page 24
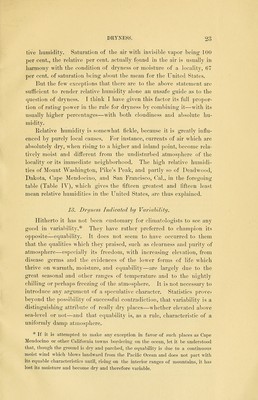
![The following table, giving fifteen places each of the greatest and least mean daily ranges of temperature for seasons and the year from all the Signal Service stations in the United States, is a sufficient proof in itself of the general statement here made. So also is the TABLE V. Places of Greatest and L>,is/ Mean Daily Ranges of Temperature {1883). Fort Apache, Arizona 38-1 La Mesilla, New Mexico 37'8 Prescott, Arizona :;:;-7 Wesi 1.1- Animas, • kriorado El Paao, Texas 34*8 Camp Thomas, Arizona . Fori Stockton, Texas Winnemucca, Nevada Yuma, Arizona 31*0 Visalia, California 26'] Fort Davis, Texas 29-7 Fort Elliott, Texas 255 Fori Concho, !• ..- 27-9 Fori Benton, Montana 24*9 . Colorado 23*4 Average SO'I Eastport, Maine 180 Provincetown, Massachusetts 126 Buffalo, New York I::-; Sandusky, Ohio 137 Indianola, Texas 11 6 Cedar Keys, Florida 13*2 Barnejrat, New Jersey 12*4 Sandy Hook, Nev ■ - 13*8 Delaware Breakwater, Delaware 1_1 Cape Mendocino, California 11 7 Hatteras, North Carolina L2*8 Block Island, Rhode bland 100 San Francisco, California 114 Key West, Florida 10-2 Galveston, Texas 9*3 Average 121 -J. < 355 33-2 . 30-1 31-4 29-2 334 321 30-2 32] •-•••.•7 26-4 28-1 28-9 26-4 386 29-2 2 l -8 22-f 266 25-4 23'9 27-9 21-4 '.'11 29-1 ■117 28-4 L8-3 10*8 30-8 346 30-8 35-8 263 •j- 5 •J7-7 22-5 L8-1 24-8 25-6 22-8 25*2 18-3 10*8 9-8 12 6 14-0 130 11-8 12-7 12-8 11-2 13-] 133 10-6 13-8 10-2 12-6 M-7 11-8 11-7 11-4 9-6 11 -6 9-0 10-2 10-2 12-6 8-4 9-6 8-8 12-9 10-8 15-4 1-J-l 12-1 124 12-9 12 5 L34 L2-] 12 5 11-6 12-4 12-2 L0-7 34-4 30-8 30-8 28-3 27-9 -;■:; -.-,•7 25-6 251 25-0 24-8 23-6 266 28-1? I I :: L3-2 130 L2-7 125 12*6 12-4 12-4 11-9 11-7 1 ] -6 l-7 LO] 9-9 96 12-0 11-9 record of the mean daily and mean monthly ranges of the twenty- five dry and the twenty-five moist localities (for the former see Tahle II, and for the latter see Tahle VI, giving monthly ranges with aver- age precipitation added), and chosen without any reference to this particular evidence. For the four divisions of climate the total mean daily and monthly ranges, averaged for the year, are as follows :](https://iiif.wellcomecollection.org/image/b21224316_0062.jp2/full/800%2C/0/default.jpg)