Fifty-fourth annual report on the health and sanitary condition of the Metropolitan Borough of Islington.
- Islington (London, England). Metropolitan Borough.
- Date:
- 1910
Licence: Attribution-NonCommercial 4.0 International (CC BY-NC 4.0)
Credit: Fifty-fourth annual report on the health and sanitary condition of the Metropolitan Borough of Islington. Source: Wellcome Collection.
116/354 page 108
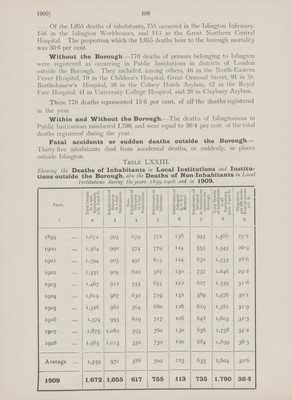
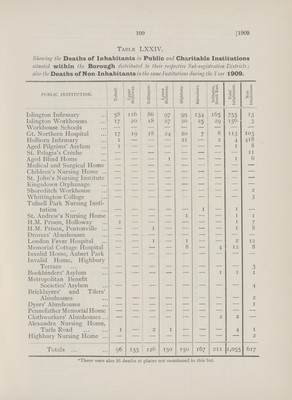
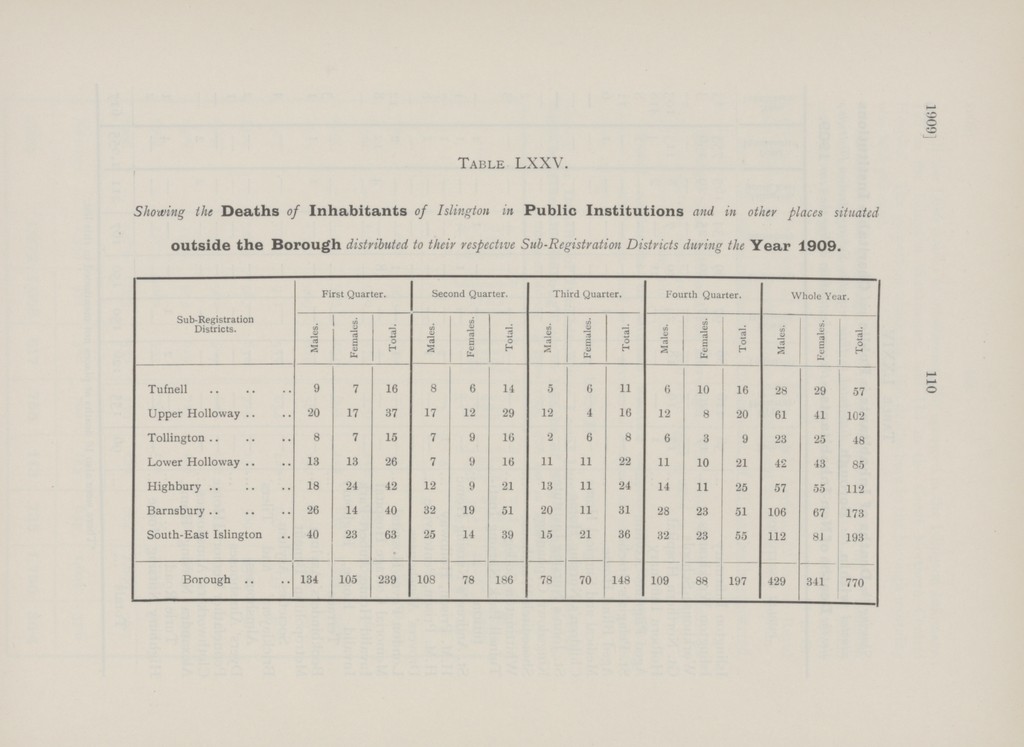
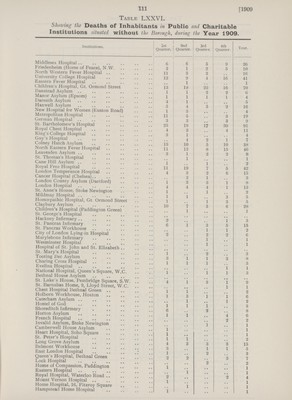
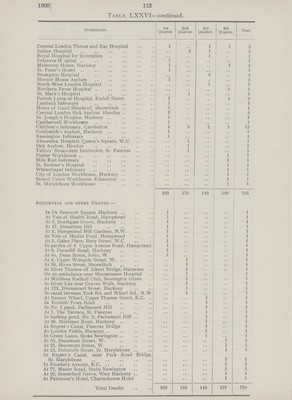
![1909] 108 Of the 1,055 deaths of inhabitants, 755 occurred in the Islington Infirmary, 156 in the Islington Workhouses, and 113 in the Great Northern Central Hospital. The proportion which the 1,055 deaths bore to the borough mortality was 30.6 per cent. Without the Borough.—770 deaths of persons belonging to Islington were registered as occurring in Public Institutions in districts of London outside the Borough. They included, among others, 46 in the North-Eastern Fever Hospital, 70 in the Children's Hospital, Great Ormond Street, 91 in St. Bartholomew's Hospital, 38 in the Colney Hatch Asylum, 42 in the Royal Free Hospital, 41 in University College Hospital, and 28 in Claybury Asylum. These 770 deaths represented 15'6 per cent. of all the deaths registered in the year. Within and Without the Borough.—The deaths of Islingtonians in Public Institutions numbered 1,790, and were equal to 36'4 per cent. of the total deaths registered during the year. Fatal accidents or sudden deaths outside the Borough.— Thirty-five inhabitants died from accidental deaths, or suddenly, in places outside Islington. Table LXXIII. Showing the Deaths of Inhabitants in Local Institutions and Institu tions outside the Borough, also the Deaths of Non-Inhabitants m Local Institutions during the years 1899-1908 and in 1909. Years. Total Deaths in Local Institutions cols. 3 and 4). Inhabitants of Islington in Local Institutions. Non Inhabitants of Islington in Local Institutions. Inhabitants in Islington Infirmary. Inhabitants of Islington in G.N.C. Hospital. Inhabitants of Islington in Institutions outside the Borough. Total Deaths of Inhabitants in all Institutions (cols. 3 and 7). Proportion per 100 deaths from all causes (col. 8). 1 2 3 4 5 6 7 8 9 1899 1,672 993 679 772 136 593 1,586 25.2 1900 1,564 990 574 779 124 553 1,543 26.9 1901 1,394 903 491 603 124 630 1,533 28.6 1902 1,531 909 622 587 130 737 1,646 29.2 1903 1,467 912 555 654 122 627 1,539 31.8 1904 1,619 987 632 719 132 589 1,576 30.1 1905 1,526 962 564 680 126 619 1,581 31.9 1906 1,574 955 619 717 106 648 1,603 31.5 1907 1,675 1,082 593 760 130 656 1.738 34.2 1908 1,565 1,015 550 750 120 684 1,699 36.3 Average 1,559 971 588 702 125 633 1,604 32.6 1909 1,672 1,055 617 755 113 735 1,790 36.4](https://iiif.wellcomecollection.org/image/b18108945_0116.jp2/full/800%2C/0/default.jpg)
 No text description is available for this image
 No text description is available for this image
 No text description is available for this image