[Report 1944] / Medical Officer of Health, Birkenhead County Borough.
- Birkenhead (England). County Borough Council.
- Date:
- 1944
Licence: Attribution 4.0 International (CC BY 4.0)
Credit: [Report 1944] / Medical Officer of Health, Birkenhead County Borough. Source: Wellcome Collection.
6/61 page 3
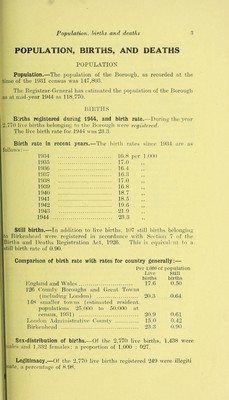
![POPULATION, BIRTHS, AND DEATHS POPULATION Population.—The population of the Borough, as recorded at the time of the 1931 census was 147,803. The Eegistrar-General has estimated the population of the Borough as at rnid-year 1944 as 118,770. BIETHS Births registered during 1944, and birth rate.—During the year 2,770 live births belonging to the Borough were registered. The live birth rate for 1944 was 23.3. Birth rate in recent years.—The birth rates since 1934 are as follows: — 1934 16.8 per 1,000 1935 17.0 1936 16.4 1937 16.3 1938 17.0 1939 16.8 1940 18.7 1941 18.5 1942 19.6 1943 21.9 1944 23.3 Still births.—In addition to live births, 107 still birtlis belonging to Birkenhead were registered in accordance with Seetio]i 7 of the Births and Deaths Eegistration Act, 1926. This is equivalent to a still birth rate of 0.90. Comparison of birth rate with rates for country generally:— Per 1,000 of population Live Still births births England and Wales 17.6 0.50 126 County Boroughs and Great Towns (including London) 20.3 . 0.64 148 smaller towns (estimated resident, populations 25,000 to 50,000 at census, 1931) 20.9 0.61 London Administrative County 15.0 0.42 Birkenhead 23.3 0.90 Sex-distributicn of births Of the 2,770 live births, 1,438 were nales and 1,332 females; a proportion of 1,000 : 927. Legitimacy.—Of the 2,770 live births registered 249 were illegiti nate, a percentage of 8.98.](https://iiif.wellcomecollection.org/image/b28927382_0007.jp2/full/800%2C/0/default.jpg)