Statistics of insanity : embracing a report of Bethlem Hospital, from 1846 to 1860, inclusive / by W. Charles Hood.
- Hood, W. Charles (William Charles), 1824-1870.
- Date:
- 1862
Licence: Public Domain Mark
Credit: Statistics of insanity : embracing a report of Bethlem Hospital, from 1846 to 1860, inclusive / by W. Charles Hood. Source: Wellcome Collection.
Provider: This material has been provided by The Royal College of Surgeons of England. The original may be consulted at The Royal College of Surgeons of England.
125/128 (page 119)
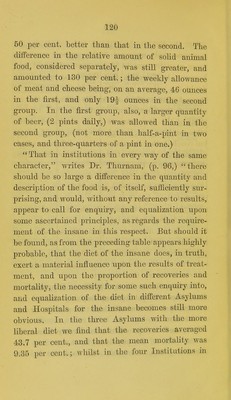
![DIET. RESULTS. SOLIDS. LIQUIDS. Prop, of Mean Annual Mortality per cent. Resident Cooked Meat and Cheese. Bread, Pudding', Flour, &c. Total Solids, except Vegeta- bles. Porridge, Milk, Soup, Broth, &c. Beer. Recove- ries per cent, of the Ad- missions. Nottingham 1 1812-40.. J ounces. 46 ounces. 202 ounces. 248 pints. 15 pints. 14 43.09 7.34 Stafford, I 1818-40.. ; 46 192 238 7 14 43.08 13.63 GUoucester, 1 1823-32.. J 46 144 190 9 14 44.94 7.19 Average of I the three J 46 179 225 10 14 43.7 9.85 Lancaster, I 1816-40.. / 24a 113^ 138J 7 3i 40.17 18.01 York (West 1 Riding), 1 1818-41.. J 18 116 134 25 •• 44.18 16.16 Suffolk, \ 1829-41.. J 16J 152 168)- 12 40.63 12.32 Middlesex, 1 1831-39.. J 18 122 140 18 n 22.12 11.69 Average of 1 the four.. J 19J: 125| 145 15 36.75 14.54 Middlesex, 1 1839-43.. f 35J 126 161| 9 7 28.75 8.56 These seven Asylums, Dr. Thurnam proceeds to state, {op. cit.i p. 96,) may be fairly divided into two groups] in one of which the diet is, or was at the time to which the table refers, considerably above, and in the other considerably below, the average diet of the county asylums as a class. In the first group, as regards solid food, the diet was](https://iiif.wellcomecollection.org/image/b22344032_0127.jp2/full/800%2C/0/default.jpg)