Genetics and the epidemiology of chronic diseases : a symposium, June 17-19, 1963, Ann Arbor, Michigan ... / edited by James V. Neel, Margery Shaw, William J. Schull.
- Date:
- 1965
Licence: Attribution-NonCommercial 4.0 International (CC BY-NC 4.0)
Credit: Genetics and the epidemiology of chronic diseases : a symposium, June 17-19, 1963, Ann Arbor, Michigan ... / edited by James V. Neel, Margery Shaw, William J. Schull. Source: Wellcome Collection.
45/412 (page 35)
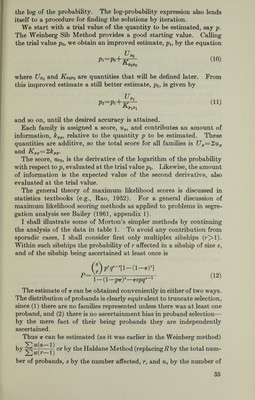
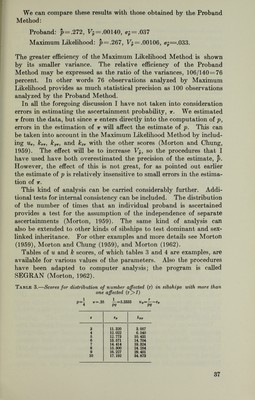
![We can compare these results with those obtained by the Proband Method : Proband: p=.272, F* = .00140, ^¿ = .037 Maximum Likelihood: p=.267, F^ = .00106, cr¿=.033. The greater efficiency of the Maximum Likelihood Method is shown by its smaller variance. The relative efficiency of the Proband Method may be expressed as the ratio of the variances, 106/140=76 percent. In other words 76 observations analyzed by Maximum Likelihood provides as much statistical precision as 100 observations analyzed by the Proband Method. In all the foregoing discussion I have not taken into consideration errors in estimating the ascertainment probability, т. We estimated 7Г from the data, but since т enters directly into the computation of p, errors in the estimation of тг will affect the estimate of p. This can be taken into account in the Maximum Likelihood Method by includ¬ ing Ur, krr, kpr, and кхт with the other scores (Morton and Chung, 1959). The effect will be to increase V^, so the procedures that I have used have both overestimated the precision of the estimate, p. However, the effect of this is not great, for as pointed out earlier the estimate of p is relatively insensitive to small errors in the estima¬ tion of 7Г. This kind of analysis can be carried considerably further. Addi¬ tional tests for internal consistency can be included. The distribution of the number of times that an individual proband is ascertained provides a test for the assumption of the independence of separate ascertainments (Morton, 1959). The same kind of analysis can also be extended to other kinds of sibships to test dominant and sex- linked inheritance. For other examples and more details see Morton (1959), Morton and Chung (1959), and Morton (1962). Tables of и and к scores, of which tables 3 and 4 are examples, are available for various values of the parameters. Also the procedures have been adapted to computer analysis; the program is called SEGRAN (Morton, 1962). Table 3.—Scores for distribution of number affected (r) in sibships with more than one affected (r]>¿) p=\ ir=.35 —=6.3333 Up=——tp 4 pg Pg 37](https://iiif.wellcomecollection.org/image/B18029164_0046.JP2/full/800%2C/0/default.jpg)