Infant mortality in Scotland / the report of a sub-committee of the Scientific Advisory Committee.
- Great Britain. Department of Health for Scotland. Scientific Advisory Committee on Medical Administration and Investigation.
- Date:
- 1943
Licence: Public Domain Mark
Credit: Infant mortality in Scotland / the report of a sub-committee of the Scientific Advisory Committee. Source: Wellcome Collection.
13/88 page 11
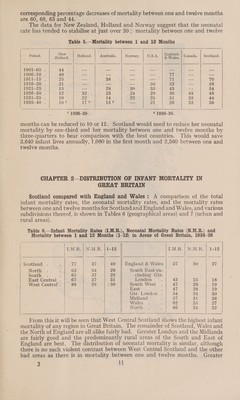
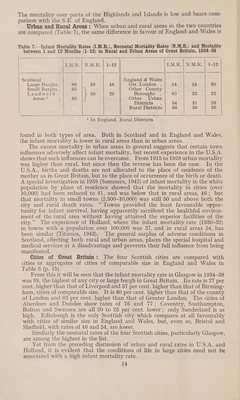
![corresponding percentage decreases of mortality between one and twelve months are 60, 68, 63 and 44. i | The data for New Zealand, Holland and Norway suggest that the neonatal rate has tended to stabilise at just over 20 ;. mortality between one and twelve Table 5.—Mortality between 1 and 12 Months Period. Z iota a Holland. Australia. Norway. U.S.A. peli Canada. | Scotland. 1901-05 . 4.4 — — — —- — — — 1906-10 . 40 — — — —— TT —- — 1911-15 . 25 — 38 — — 71 -. 70 1916-20 . 21 = — — 50 53 — 58 1921-25 . 15 — 28 30 35 43 — 54. 1926-30 . 12 32 23 24 29 36 48 48 1931-35 . 10 22 14 22 25 31 38 44 1936-40 . |. 10! Vinee 12.2 — 21 26 32 39 1 1936-39. 4 1936-38. months can be reduced to 10 or 12. Scotland would need to reduce her neonatal mortality by one-third and her mortality between one and twelve months by three-quarters to bear comparison with the best countries. This would save 3,640 infant lives annually, 1,080 in the first month and 2,560 between one and twelve months. CHAPTER 2—DISTRIBUTION OF INFANT MORTALITY IN GREAT BRITAIN Scotland compared with England and Wales: A comparison of the total infant mortality rates, the neonatal mortality rates, and the mortality rates between one and twelve months for Scotland and England and Wales, and various subdivisions thereof, is shown in Tables 6 (geographical areas) and 7 (urban and rural areas). Table 6.—Infant Mortality Rates (I.M.R.), Neonatal Mortality Rates (N.M.R.) and Mortality between 1 and 12 Months (1-12) in Areas of Great Britain, 1984-38 | | I.M.R. | N.M.R. | 1-12 | EMR. NeMLR. | 1-12 Scotland . : rig od 40 England & Wales 57 30 27 North . : 63 34 29 * South East ex- south ~. ; 65 37 28 cluding Gtr. East Central . 67 37 31 London ; 43 25 18 West Central . 88 38 » 50 South West . 47 28 1y East : ; 47 28 19 Gtr. London . 54 24 30 Midland | 3 57 al 26 | Wales. 62 eg Cae 5 | Nerth-—. a 66 34 ri Ao | | | From this it will be seen that West Central Scotland shows the highest infant mortality of any region in Great Britain. The remainder of Scotland, Wales and the North of England are all alike fairly bad. Greater London and the Midlands are fairly good and the predominantly rural areas of the South and East of England are best. The distribution of neonatal mortality is similar, although there is no such violent contrast between West Central Scotland and the other bad areas as there is in mortality between one and twelve months. Greater 3 1]](https://iiif.wellcomecollection.org/image/b32174640_0013.jp2/full/800%2C/0/default.jpg)