Infant mortality in Scotland / the report of a sub-committee of the Scientific Advisory Committee.
- Great Britain. Department of Health for Scotland. Scientific Advisory Committee on Medical Administration and Investigation.
- Date:
- 1943
Licence: Public Domain Mark
Credit: Infant mortality in Scotland / the report of a sub-committee of the Scientific Advisory Committee. Source: Wellcome Collection.
37/88 page 35
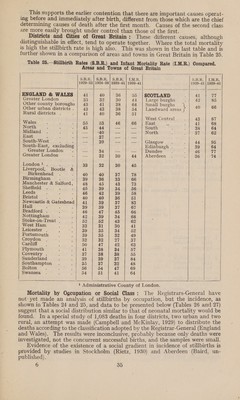
![This supports the earlier contention that there are important causes operat- ing before and immediately after birth, different from those which are the chief determining causes of death after the first month. Causes of the second class are more easily brought under control than those of the first. Districts and Cities of Great Britain: These different causes, although distinguishable in effect, tend to operate together. Where the total mortality is high the stillbirth rate is high also. This was shown in the last table and is further shown in a comparison of areas and towns in Great Britain in Table 25. Table 25.—Stillbirth Rates (S.B.R.) and Infant Mortality Rate (I.M.R.) Compared. Areas and Towns of Great Britain == — . £ — 3.D.R..| S.B.R. |'S.B.R.' 1-1 MLR. 5.B.R .B.R. | IL.M.R. 1929-33 | 1934-38 | 1939-41 | 1939-41 1939-41 | 1939-41 ENGLAND & WALES 4] 4.0 36 55 | §COTLAND i 4] 77 Greater London pg Sy, 32 30 44 | Large burghs .] 42 85 Other county boroughs | 43 4] 38 64 | Small burghs s 40 66 Other urban districts . 43 43 38 54 Landward areas Rural districts . : 4] 40 36 51 West Central . | 43 87 Wales 1 OD 53 46 66 | East a te iia 9 68 North ; ‘ , 45 44 — — South é J 38 64 Midland . . d a ‘40 — — North d ; 37 62 East 2 : ; et. 37 eee — South-West ras aes 39 — — | Glasgow. ' 44 95 South-East, excluding Edinburgh . : 39 64 Greater London ; ate 34 = — Dundee q : 46 17 Greater London ; ae 32 30 44 Aberdeen . : 36 74 London! , , j 33 32 30 45 Liverpool, Bootle & Birkenhead . ’ 40 40 37 78 Birmingham . : 39 36 33 66 Manchester & Salford, 48 45 43 73 Sheffeld . ; ; 45 39 34 56 Leeds : 3 : 46 42 39 58 Bristol , 40 40 36 5] Newcastle & Gateshead| 41 | 39 | 37 | 83 Hull ; : ‘ Bradford . i : 46 47 45 66 Nottingham . : 42 39 34 68 Stoke-on-Trent . poh . 62 52 43 62 West Ham : fe 33 31 30 4] Leicester . ; ; 39 35 34. 52 Portsmouth : : 39 35 32 49 Croydon , : 32 32 27 37 Cardiff : i : 50 47 42 63 Plymouth A 4] 38 34 57 Coventry . : : 37 38 38 55 Sunderland . ‘ 39 39 37 84 Southampton . : 35 37 32 48 Bolton ; Ags: 56 54 47 69 Swansea . ; : 54. 51 4) 64 SS a a pe a a ot 1 Administrative County of London. Mortality by Occupation or Social Class: The Registrars-General have not-yet made an analysis of stillbirths by occupation, but the incidence, as shown in Tables 24 and 25, and data to be presented below (Tables 26 and 27) suggest that a social distribution similar to that of neonatal mortality would be found. In a special study of 1,083 deaths in four districts, two urban and two rural, an attempt. was made (Campbell and McKinlay, 1929) to distribute the deaths according to the classification adopted by the Registrar-General (England and Wales). The results were inconclusive, probably because only deaths were investigated, not the concurrent successful births, and the samples were small. Evidence of the existence of a social gradient in incidence of stillbirths is provided by studies in Stockholm (Rietz, 1930) and Aberdeen (Baird, un- published).](https://iiif.wellcomecollection.org/image/b32174640_0037.jp2/full/800%2C/0/default.jpg)