Infant mortality in Scotland / the report of a sub-committee of the Scientific Advisory Committee.
- Great Britain. Department of Health for Scotland. Scientific Advisory Committee on Medical Administration and Investigation.
- Date:
- 1943
Licence: Public Domain Mark
Credit: Infant mortality in Scotland / the report of a sub-committee of the Scientific Advisory Committee. Source: Wellcome Collection.
46/88 page 44
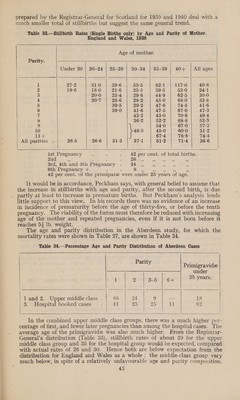
![The advantages of superior physique and health more than compensate for the other disadvantages. How far, then, can unfavourable age and parity be held responsible for the excess stillbirths in Scotland? To answer this question, the data shown in Table 35 have been assembled. The Registrar-General gives the age and parity distribution of all births in the areas shown, but not the stillbirth rates by age and parity for the separate areas. A comparison has therefore been made on the assumption that the rates would be the same as for England and Wales as a whole. The calculated English and Welsh rates differ only slightly from area to Table 35.—Stillbirth Rates for 1938 ane Calculated x Actual legitimate | ,..-4: 1, | Gross repro- | Birth- Bae stillbirth rate. ge er oe ay duction rate.| rate. | Scotland . 5 41-9 } 35:4 1-08 L7<7 England and Wales . 37°5 37°5 0-90 15-1 Greater London . 29-9 38-2 0-79 14-3 South-East, exclud- . ing Greater London 33°5 37:5 0-89 14-5 South-West . i 39°3 38:2 0:88 13-6 East: * = 2 36-6 37°1 0:95 14-7 Midland]. i 35:9 SEY | 0:99 16-4 Midland II . ‘ 39-6 38-0 0-91 15-4 North I : al 38:5 36-6 1-00 16-8 North II ; ; 35:9 36°4 1-03 16-6 North IIL734. : 40-2 36-9 0-91 15-3 North IV. : 45-9 37°3 0-89 1511 || Wales I : : 47-7 37-4 0:97 15-4 Wales II ] ; 46:0 38°7 0:96 14:8 1 Legitimate stillbirth rate for 1939. area with a range from 36-4 to 38-7. Greater London, with a worse than average age and parity distribution, has the lowest rate of all. Of the four other areas with actual stillbirth rates below the average, three have better than average distributions. Of the seven areas with rates above the average, four have better and three worse than average distributions. Hence in England and Wales, there is no obvious correlation between age and parity distribution and stillbirth rate. In Scotland the age and parity distribution is more favourable to a low stillbirth rate than in any of the English areas, but its actual rate is higher than any except North IV and the two Welsh areas. This point is further illustrated by the following table. : Table 36.—Distribution of Stillbirths by Age of Mother in Selected Areas. 1938 Age of mother. | | Place’ a All ages. | Under 20 | 20-24 | 25-29 | 30-34 | 35-39 | 40—44 ae es — — H | -— New York State, exclud- | ing New York City . | 28 25 21 24 31 42 oY | TYerushalmy, 1940. ] | | | | Greater London . ' 31 24 22 27 29 42 60 | 122 England, North 1V ; 46 35 35 40 47 67 80 | 86 Wales I : 4 48 34 33 40 48 67 uu 157 England and Wales. 38 29 28 32 38 53 | 102 * astoa snaernnenateens Naseer nearer — SY See ee nS eee et ene te](https://iiif.wellcomecollection.org/image/b32174640_0046.jp2/full/800%2C/0/default.jpg)