Report on confidential enquiries into maternal deaths in England and Wales 1961-1963 / by Arnold L. Walker [and others].
- Great Britain. Ministry of Health.
- Date:
- 1966
Licence: Public Domain Mark
Credit: Report on confidential enquiries into maternal deaths in England and Wales 1961-1963 / by Arnold L. Walker [and others]. Source: Wellcome Collection.
100/104 (page 90)
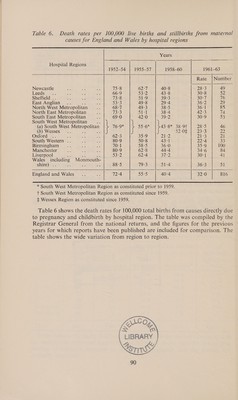
![causes for England and Wales by hospital regions Years Hospital Regions 1952-54 | 1955-57 1958-60 1961-63 Rate | Number Newcastle ef a 1 75°8 62°7 40:8 28:3 49 Leedst a. . a “ Si 66:9 53°2 43°8 30°S 52 Sheffield . 4 et ‘Y 73°8 piety 39-3 30-7 76 East Anglian A hs aye hes) 49-8 29-4 36°72 = 4h poe North West Metropolitan Ae 68 -7 49-3 38-5 36:1 85 North East Metropolitan 1 7333 51-1 38-4 42:3 714 South East Metropolitan +s 69-0 42-0 39-2 30°9 53 South West Metropolitan A. ) (a) South West Sees 76:9* 55 -6* 43-8* 38-97 28°5 46 (b) Wessex 4 52 -O+ 2379 22 Oxford 3: ty > A 623 35-9 21-2 21-3 21 South Western .. 4 he 80-9 50-8 43-1 22°4 33 Birmingham ... ut a 70-1 58:5 36-0 35°9 100 Manchester ys a a: 80-9 62:8 44-4 34-6 84 Liverpool 3352 62°4 Sic 2 30-1 4] Wales including Monmouth- Shire)iee Ae tH 7e 88-5 79 3 51°4 36:3 51 England and Wales... ba 72-4 mia 40-4 32-0 816 * South West Metropolitan Region as constituted prior to 1959. + South West Metropolitan Region as constituted since 1959. + Wessex Region as constituted since 1959. Table 6 shows the death rates for 100,000 total births from causes directly due to pregnancy and childbirth by hospital region. The table was compiled by the Registrar General from the national returns, and the figures for the previous years for which reports have been published are included for comparison. The table shows the wide variation from region to region. Ke QA0 O an “LIBRARY | Pie 90](https://iiif.wellcomecollection.org/image/b32183471_0100.jp2/full/800%2C/0/default.jpg)