[Report 1952] / Medical Officer of Health, Meriden R.D.C.
- Meriden (England). Rural District Council.
- Date:
- 1952
Licence: Attribution 4.0 International (CC BY 4.0)
Credit: [Report 1952] / Medical Officer of Health, Meriden R.D.C. Source: Wellcome Collection.
11/48 page 8
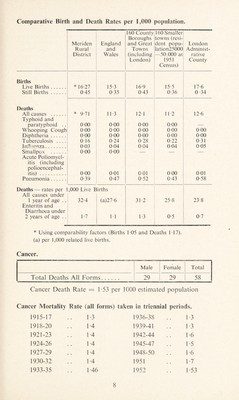
![Comparative Birth and Death Rates per 1,000 population. « Meriden Rural District England and Wales 160 County Boroughs and Great Towns (including London) 160 Smaller towns (resi¬ dent popu- lation25000 —50,000 at 1951 Census) London Administ¬ rative County Births Live Births. * 16-27 15-3 16-9 15-5 17-6 Still Births. 0-45 0-35 0-43 0-36 0-34 Deaths All causes . * 9-71 11-3 12-1 11-2 12-6 Typhoid and paratyphoid . . 0-00 0-00 0-00 0-00 Whooping Cough 0-00 0-00 0-00 0-00 0-00 Diphtheria. 0-00 0-00 0-00 0-00 0-00 Tuberculosis .... 0-16 0-24 0-28 0-22 0-31 Influenza. 0-03 0-04 0-04 0-04 0-05 Smallpox ...... 0-00 0-00 — — — Acute Poliomyel¬ itis (including polioencephal¬ itis) . 0-00 0-01 0-01 0-00 0-01 Pneumonia. 0-39 0-47 0-52 0-43 0-58 Deaths — rates per ] All causes under 1 year of age .. ,000 Live B 32-4 irths (a)27-6 31-2 25-8 23-8 Enteritis and Diarrhoea under 2 years of age .. 1-7 M 1-3 0-5 0-7 * Using comparability factors (Births 1-05 and Deaths 1-17). (a) per 1,000 related live births. Cancer. Male Female Total Total Deaths All Forms. 29 29 58 Cancer Death Rate = 1-53 per 1000 estimated population Cancer Mortality Rate (all forms) taken in triennial periods. 1915-17 1-3 1936-38 F3 1918-20 1-4 1939-41 1-3 1921-23 1-4 1942-44 F6 1924-26 1-4 1945-47 1-5 1927-29 1-4 1948-50 1 -6 1930-32 14 1951 1-7 1933-35 146 1952 1-53](https://iiif.wellcomecollection.org/image/b2979691x_0011.jp2/full/800%2C/0/default.jpg)