[Report 1952] / Medical Officer of Health, Nottinghamshire County Council.
- Nottinghamshire County Council
- Date:
- 1952
Licence: Attribution 4.0 International (CC BY 4.0)
Credit: [Report 1952] / Medical Officer of Health, Nottinghamshire County Council. Source: Wellcome Collection.
155/162 page 153
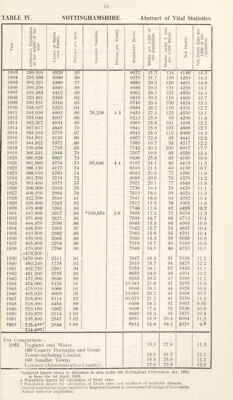
![TABLE IV. NOTTINGHAMSHIRE. Abstract of Vital Statistics. Year Estimated Population at the middle of the year ICxcess of Births over Deaths Persons per Acre Separate. P'amilies Persons per Family Registered Births Births per 1,000 of the population Deaths under 1 year per 1,000 Births Net Deaths Net Death Rate per 1,000 of the \ opulatiou 1903 289,001 4926 .55 1 9072 1 31.3 134 4146 14.3 1904 295,586 5086 .56 9379 31.7 139 4293 14.5 1905 302,321 4389 .57 8880 29.3 126 4491 14.8 190(S 309,209 4849 .59 9088 29.3 121 4239 13.7 1907 316,355 4412 .60 8962 28.3 127 4550 14.3 1908 323,461 5358 .62 9818 30.3 119 4460 13.7 1909 330,831 5316 .63 9740 29.4 106 4424 13.3 1910 338.937 5223 .64 9554 28.2 110 4331 12.7 1911 345,930 4903 .66 76,236 4.5 9453 27.3 125 4550 13.1 1912 355,046 5007 .68 9213 25.9 93 4206 11.8 1913 362,307 4934 .69 9369 25.8 101 4435 12.2 1914 367,617 4845 .70 9541 25.9 107 4696 12.7 1915 353,193 3775 .67 8843 25.0 112 5068 14.3 1916 344,501 4126 .66 8567 22.8 95 4441 12.8 1917 344,822 3372 .66 7589 19.7 95 4217 12.2 1918 339,456 1725 .65 7742 20.3 100 6017 17.7 1919 366,331 2948 .70 7507 19.6 95 4559 12.4 1920 380,928 5667 .73 9836 25.8 85 4169 10.9 1921 381,969 4774 .73 85,646 4.4 9187 24.1 86 4413 11.5 1922 386,130 4177 .74 8316 21.5 69 4139 10.7 1923 388,019 3763 .74 8023 20.6 77 4260 11.0 1924 391,700 3715 .75 8085 20.6 79 4370 11.2 1925 393,400 3373 .75 7921 20.1 77 4548 11.6 1926 398,900 3310 .75 7739 19.4 73 4429 11.1 1927 408,100 2984 .78 7613 18.6 69 4629 11.3 1928 422.700 3549 .81 .... 7941 18.8 64 4392 10.4 1929 429,300 2242 .82 7517 17.5 76 5095 11.8 1930 439,400 3261 .84 7746 17.6 62 4485 10.2 1931 447,900 2617 .86 *109,674 3.9 7695 17.2 72 5078 11.3 1932 451,600 2821 .86 7534 16.7 66 4713 10.4 1933 444,970 2036 .86 6945 15.5 68 4909 10.9 1934 448,500 2395 .87 7042 15.7 54 4647 10.4 1935 453,500 2382 .86 7083 15.6 56 4701 10.4 1936 459,000 2005 .88 7033 15.3 58 5028 10.9 1937 465,800 2218 .89 7318 15.7 59 5100 10.9 1938 470,900 2796 .90 7549 16.0 46 4753 10.1 rt!478,200 ) 1939 6479,900 ' 2511 .91 7847 16.4 51 5336 11.1 1940 483,240 1735 .92 7610 15.7 58 5875 12.2 1941 492.750 2501 .94 7954 16.1 62 5453 11.1 1942 481,200 3755 .92 8659 18.0 48 4904 10.2 1943 472,300 3946 .90 9255 20.2 47 5309 11.2 1944 474,960 5125 .91 10,343 21.8 47 5218 11.0 1945 475,910 4068 .91 9096 19.1 44 5028 10.5 1946 495,620 4693 .95 10,001 20.2 41 5308 10.7 1947 505,690 5114 .97 10,673 21.2 41 5559 11.0 1948 518,300 4483 .99 9486 18.3 42 5003 9.65 1949 523,160 3562 .99 9098 17.4 32 5536 10.6 1950 533,870 3114 1.01 8683 16.3 34 5571 10.4 1951 535,800 2547 1.02 8551 15.9 29.4 6004 11.2 1952 535-410 + 3244 1.02 8515 15-9 29-3 5271 9.8 ' 534-400: For Comparison— 1952 England and Wales 15.3 27.6 11.3 160 County Boroughs and Great Towns including London 16.9 31.2 12.1 160 Smaller Towns 15.5 25.8 11.2 I.ONDON (Administrative Count}-) 17.6 23.8 12.6 * Adjusted figures owing to alteration in area under the Nottingham Corporation Act, 1932, as from the 1st April, 1933. a Population figures for calculation of Birth rates. h Po]uilation figures for calculation of Death rates and incidence of notifiable diseases. 'Special constructed figure supplied by Registrar General in consequence of change of botindaries. ;.\ctual mid-year population.](https://iiif.wellcomecollection.org/image/b29925344_0155.jp2/full/800%2C/0/default.jpg)