[Report of the Medical Officer of Health for Westminster, City of].
- City of Westminster (London, England). County Council.
- Date:
- [1924?]
Licence: Attribution-NonCommercial 4.0 International (CC BY-NC 4.0)
Credit: [Report of the Medical Officer of Health for Westminster, City of]. Source: Wellcome Collection.
20/76 page 12
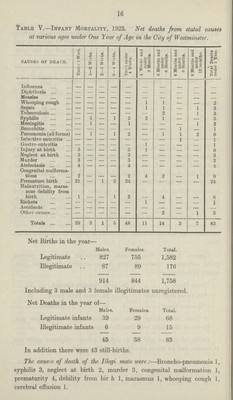
![12 both sexes as compared with 1922, but it is more marked among males, and the female rate is higher than in 1921. Divided into various age periods we get:— [####]1923. Under 1. 1 to 2. 2 to 5. 5 to 15. 15 to 25. 25 to 45. 45 to 65. 65 and up. Total.9/###] M. 45 6 4 9 23 86 269 314 756 F. 38 10 9 10 23 85 194 368 737 1919 140 24 31 33 80 265 570 676 1,819 1920 167 18 21 27 53 222 517 575 1,600 1921 154 28 32 35 56 204 499 615 1,623 1922 104 26 32 41 62 211 584 736 1,796 1923 83 16 13 19 46 171 463 682 1,493 which give rates per 1,000 estimated to be living at these periods as follows:— Under 5. 5·15. 15·25. 25·45. 45·65. 65 & Up. All Ages. 1921 M 41·0 2·8 2·4 5·2 18·8 92 0 14·6 1922 M 340 2·7 2·7 5·5 21·1 1000 15·6 1923 M 18·2 1·4 20 4·3 17·6 860 12·6 1921 F 28·8 2·0 11 30 10·6 60·0 90 1922 F 22·3 31 2·0 3·2 13·5 80·0 10·7 1923 F 18·0 1·3 1·4 2·7 10·7 76·4 91 The number of deaths attributed to various causes and at various age periods are set out in the table appended to this section of the Report. In almost every class of disease the numbers of deaths recorded were below those recorded in 1922. The exceptions were : Cancer in males (111 against 96), nervous diseases (both sexes), kidney or bladder diseases (both sexes), rheumatic fever (both sexes), accidents (both sexes), syphilis (both sexes), alcoholism (in males). The deaths were distributed in the wards in the years 1920,1921,1922 and 1923 as follows :— {###) 1920. 1921. 1922. 1923. M. F. Total. M. F. Total. M. F. Total. M. F. Total. Conduit 9 14 23 8 12 20 6 18 24 11 12 23 Grosvenor 47 55 102 57 50 107 56 68 124 48 47 95 Hamlet 17 31 48 18 29 47 37 29 66 29 30 59 K. St. George 48 54 102 55 55 110 64 56 120 45 56 101 Victoria 210 254 464 234 233 467 249 283 532 217 261 478 St. Margaret 62 44 106 44 37 81 52 49 101 43 37 80 St. John 198 168 366 214 162 376 240 203 443 170 166 336 St. Anne 53 44 97 47 36 83 35 30 65 39 21 60 Gt. Marlborough 19 18 37 16 12 28 19 17 36 9 15 24 Pall Mall 26 7 33 20 11 31 24 11 35 12 12 24 Regent 43 18 61 35 37 72 27 32 59 21 30 51 Charing Cross 15 11 26 28 10 38 19 7 26 18 9 27 Covent Garden 31 36 67 38 23 61 40 28 68 34 22 56 6trand 42 7 49 57 12 69 49 13 62 42 8 50 Homeless 11 8 19 26 7 33 23 12 35 18 11 29](https://iiif.wellcomecollection.org/image/B18247854_0020.jp2/full/800%2C/0/default.jpg)