Report of the Medical Services, Ministry of Health, Sudan Government.
- Sudan. Wizārat al-Ṣiḥḥah. Medical Services.
- Date:
- [1951]
Licence: Public Domain Mark
Credit: Report of the Medical Services, Ministry of Health, Sudan Government. Source: Wellcome Collection.
13/68 page 7
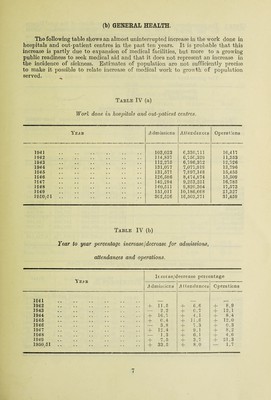
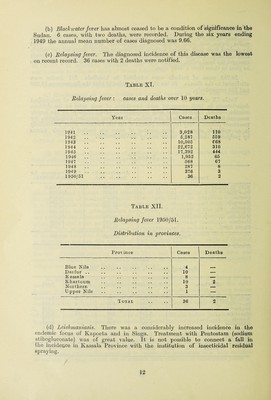
![(b) GENERAL HEALTH. The following table shows an almost uninterrupted increase in the work done in hospitals and out-patient centres in the past ten years. It is probable that this increase is partly due to expansion of medical facilities, but more to a growing public readiness to seek medical aid and that it does not represent an increase in the incidence of sickness. Estimates of population are not sufficiently precise to make it possible to relate increase of modical work to growth of population served. Table IV (a) Work done in hospitals and out-patient centres. Ye^b Admissions Attendances Operations 194 ] . 103,023 6,330,711 10,417 1942 . ] 14,837 6,7 50,329 11,353 1943 . 112,275 6,796,372 12,726 1944 . 131,077 7,077.919 13,796 1945 . 131,571 7,897,148 15,455 1246 . 126,586 8,474,874 15,509 1247 . 142,294 9,253,251 16,785 1248 . 140,511 9,820,304 17,573 1249 . 151,011 10,186,668 21,327 1950/51. 302,526 16,503,371 31,459 Table IV (b) Year to year percentage increase!decrease for admissions, attendances and operations. Y E^ B Ir.cieas/c ^crease perce ntage A dmissions A ttendances Operations 1241 .. . 1942 . + 11.5 + 6.6 -}- 8.9 1943 . — 2.2 + 0.7 + 12.1 1944 . + 16.7 + 4.1 + 8.4 1945 . + 0.4 -f 11.6 + 12.0 1946 . — 3.8 + 7.3 4- 0.3 1947 . + 12.4 + 9.1 + 8.2 1948 . — 1.3 + 6.1 + 4.6 1949 . -j- 7.5 + 3.7 + 21.3 1950;51. + 33.5 + 8.0 — 1.7](https://iiif.wellcomecollection.org/image/b31639021_0013.jp2/full/800%2C/0/default.jpg)