[Report 1955] / Medical Officer of Health, Dorking U.D.C.
- Dorking (England). Urban District Council.
- Date:
- 1955
Licence: Attribution 4.0 International (CC BY 4.0)
Credit: [Report 1955] / Medical Officer of Health, Dorking U.D.C. Source: Wellcome Collection.
7/90
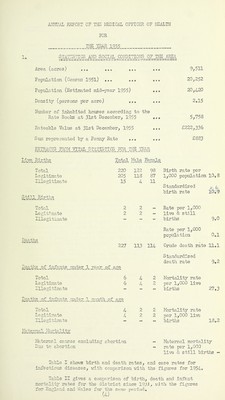
![AimUKL REPORT 0? THE llEDIGAL OFFICER OF tEALTH FOR 1955_. 1, ^atjstics^..ap]^sjcx%gond:[tiof§^^^ A]?© cl (© CK?© s} roci »«» *99 Popnlation (C©nsus 195l) •*. .«• Population (Estimated mid-year 1955) o.• Density (persons per acre) 9^511 20;252 20,420 2,15 Number of inhabited houses according to the Rate Books at 31st December, 1955 •e® 5,758 Rateable Value at 31st December, 1955 £222,336 Sum represented by a Penny Rate £883 EXTRACTS FROM VITAL STATISTICS FOR, T_HB. lEAR Diye - B_ir“fes. Female Total 220 122 98 Birth rate per Legitimate 205 118 87 1,000 population 10,8 Illegitimate 15 4 11 Standardised J/- (=> birth rate 10,9 S till, _B_ir t hs Total 2 2 Rate per 1,000 Legitimate 2 2 - live & still Illegitimate - „ - births 9«0 Deaths Rate per 1,000 population 0,1 227 113 114 Crude death rate 11.1 Standardised death rate 9.2 Death-S of infants under 1 year of age Total 6 4 2 Pbrtality rate Legitimate 6 4 2 per 1,000 live Illegitim£,te - ~ - births 27.3 Deaths of infants under 1 month of age Total 4 2 2 Mortality rate Le gitimate 4 2 2 per 1,000 live Illegitimate - - births 18.2 laternel Mrtalitv I'ktemsl causes excluding abortion Due to abortion Maternal mortality rate per 1,000 live & still births - Table I shofvrs birth and death rates, and case rates for infectious diseases, with comparison with the figures for 1954« Table II gives a compa.rison of birth, death and infant mortality rates for the district since 193J., with the figuues for England and Wales for the same period, (4)](https://iiif.wellcomecollection.org/image/b29165003_0009.jp2/full/800%2C/0/default.jpg)