[Report of the Medical Officer of Health for London County Council 1964].
- London County Council (London, England). County of London.
- Date:
- 1966
Licence: Attribution-NonCommercial 4.0 International (CC BY-NC 4.0)
Credit: [Report of the Medical Officer of Health for London County Council 1964]. Source: Wellcome Collection.
17/187 page 13
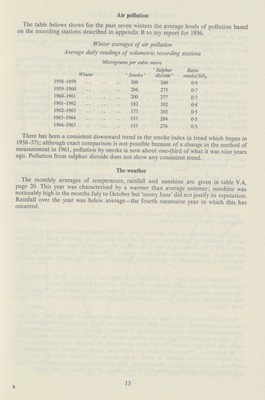
![Air pollution The table belows shows for the past seven winters the average levels of pollution based on the recording stations described in appendix B to my report for 1956. Winter averages of air pollution Average daily readings of volumetric recording stations Micrograms per cubic metre Winter ' Smoke' ' Sulphur dioxide' Ratio smoke/SO2[/##] 1958-1959 309 340 0.9 1959-1960 206 275 0.7 1960-1961 200 277 0.7 1961-1962 182 302 0.6 1962-1963 173 365 0.5 1963-1964 153 284 0.5 1964-1965 133 276 0.5 There has been a consistent downward trend in the smoke index (a trend which began in 1956-57); although exact comparison is not possible because of a change in the method of measurement in 1961, pollution by smoke is now about one-third of what it was nine years ago. Pollution from sulphur dioxide does not show any consistent trend. The weather The monthly averages of temperature, rainfall and sunshine are given in table V.4, page 20. This year was characterised by a warmer than average summer; sunshine was noticeably high in the months July to October but 'sunny June' did not justify its reputation. Rainfall over the year was below average—the fourth successive year in which this has occurred. B 13](https://iiif.wellcomecollection.org/image/b18253088_0017.jp2/full/800%2C/0/default.jpg)