Supplement to the annual report on the health of the urban sanitary district of Haydock for the year 1897 : containing (1) a life-table for Haydock, based on the mortality of the 10 years, 1881-90, and (2)other tables, setting forth the leading vital statistics for the same decennium / by T.E. Hayward.
- Hayward, T.E.
- Date:
- 1898
Licence: Public Domain Mark
Credit: Supplement to the annual report on the health of the urban sanitary district of Haydock for the year 1897 : containing (1) a life-table for Haydock, based on the mortality of the 10 years, 1881-90, and (2)other tables, setting forth the leading vital statistics for the same decennium / by T.E. Hayward. Source: Wellcome Collection.
Provider: This material has been provided by London School of Hygiene & Tropical Medicine Library & Archives Service. The original may be consulted at London School of Hygiene & Tropical Medicine Library & Archives Service.
25/60 page 23
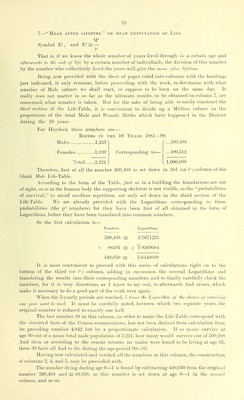
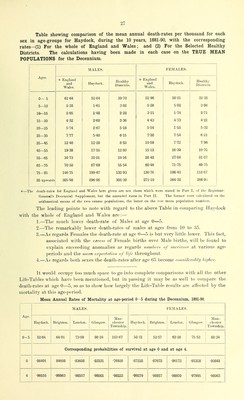
![7—Mean after lifetime or mean extkctatiun of Life. Symbol E''', and V/ = — /■■■ That is, if we know the whole nuiiil)fr of years liv<'d tlii'nugli /// a certain age and afterwar(U to the end of life ])y a certain number of individuals, the division of this numl)er by the number who collectively lived the years will give the nwon of/er Hf'time. Being now provided witli the sheet of paper ruled into coluiuiis with the headings just indicated, it only remains, before proceeding with the work, to determine with what number of Male infants we shall start, or suppose to be born on the same day. It really does not matter in so far as the ultimate results, to be obtained in column 7, are concerned, what number is taken. But for the sake of being able to easily construct the third section of the Life-Table, it is convenient to divide up a Million infants in the proportions of the total Male and Female Births which have happeneil in the District during the 10 years. For Hay dock these numbers are— Births in the 10 Years 1881—90. Males 1,235^ ....509,488 Females 1,189 J> Corresponding to—\ ...4il0,ol2 ^ 1,000,000 'J otal 2,424 j Therefore, first of all the number 509,488 is set down in 3rd (or I'') column of the blank Male Life-Table. According to the form of the Table, just as in a building the foundations are out of sight, or as in the human body the supporting skeleton is not visible, so the probabilities of survival, to avoid needless repetition, are only set down in the third section of the Life-Table. We are already provided with the Logarithms corresponding to these probabilities (the p'' numbers) for ihey have been first of all obtained in tlie form of Logarithms, before they have been translated into common numbers. So the first calculation is— Numbei's. Locrarithnis. 509,488 — 5-7071255 X -86491 — + 1-93(39684 440,650 — 5-6440939 It is most convenient to proceed with this series of calculations right on to the bottom of the third (or I'- ) column, adding in succession the several Logarithms and translating the results into their corresponding numbers, and to finally carefully check the numbers, for it is very disastrous, as I kiiow to my cost, to afterwards find errors, whicli make it necessary to do a good part of the work over again. AVhen the 5-yearly periods are reached, o times the I^ogarithm of the cliance of surririmj one year inust he used. It must be carefully noted, between which two separate years, the original number is reduced to exactly one half The last number 39 in this column, in order to make the Life-Table correspond with the observed facts of the Census enumerations, has not been derived from calculation from its preceding number 4,842 but by a proportionate calculation. If so many survive at age 90 out of a mean total male population of 3,211, how many would survive out of 509,488 And then as according to the census returns no males were found to be living at age 95, these 39 have all had to die during the age-period 90—-95. Having now calculated and verified all the numbers in this column, the construction of columns 2, 4, and 5, may be proceeded with. The number dying during age 0—1 is found by subtracting 440,650 from the original number 509,488 and — 68,838, so this number is set down at age 0—1 in the second column, and so on.](https://iiif.wellcomecollection.org/image/b24398081_0025.jp2/full/800%2C/0/default.jpg)