Report of the Joint board consisting of the Metropolitan park commission and the State board of health : upon the improvement of Charles River from the Waltham line to the Charles River bridge. April, 1894.
- Massachusetts. Joint Board upon Improvement of Charles River.
- Date:
- 1894
Licence: Public Domain Mark
Credit: Report of the Joint board consisting of the Metropolitan park commission and the State board of health : upon the improvement of Charles River from the Waltham line to the Charles River bridge. April, 1894. Source: Wellcome Collection.
113/120 (page 67)
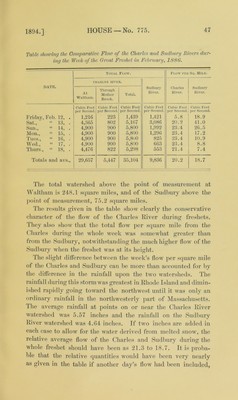
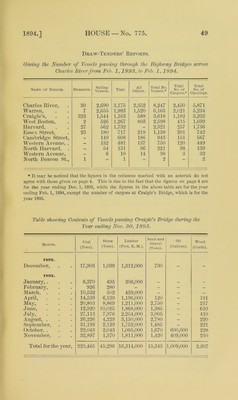
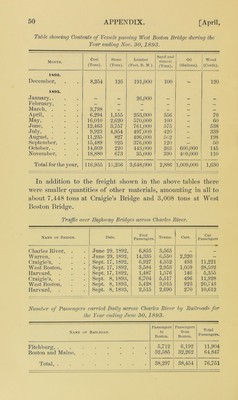
![1894.] Draav-Tenders’ Reports. Giving the Number of Vessels passing through the Highway Bridges aeross Charles River from Feb. 1, IS 9 3, to Feb. 1, IS 94. Name of Bridge. Steamers. Sailing Vessels. Tugs. All Others. Total No. Vessels.* Total No. of Cargoes.* Total No. of Openings. Charles River, 30 2,690 3,175 2,352 8,247 2,450 5,871 Warren, 7 2,655 1,983 1,520 6,165 2,021 5,234 Craigie’s, 323 1,544 1,163 588 3,618 1,182 3,232 West Boston, 2 526 1,267 803 2,598 415 1,699 Harvard, 27 562 1,732 - 2,321 257 1,736 Essex Street, 23 180 717 218 1,138 201 742 Cambridge Street, — 149 608 186 943 151 567 Western Avenue, . — 132 481 137 750 120 449 North Harvard, . — 54 131 36 221 38 139 Western Avenue, — 6 18 14 38 3 32 North Beacon St., 1 1 2 “ 2 * It may be noticed that the figures in the columns marked with an asterisk do not agree with those given on page 4. This is due to the fact that the figures on page 4 are for the year ending Dec. 1, 1893, while the figures in the above table are for the year ending Feb. 1, 1894, except the number of cargoes at Craigie’s Bridge, which is for the year 1893. Table showing Contents of Vessels passing Craigie's Bridge during the Year ending Nov. 30,1893. Month. Coal (Tons). Stone (Tons). Lumber (Feet, B. M.). Sami and Gravel (Tons). Oil (Gallons). Wood (Cords). 1892. December, 17,903 1,039 1,312,000 730 - - 1893. January,. 6,370 495 206,000 — — — February, 926 280 - - - - March, . 10,532 502 459,000 - - — April, 14,539 6,139 1,196,000 120 - 191 May, 20,803 8,869 1,211,000 2,750 - 217 June, 12,920 10,025 1,868,000 1,385 — 610 July, 27,113 7,976 2,254,000 3,005 — 410 August, . 26,226 4,229 3,150,000 2,780 — 220 September, 31,193 2,129 1,752,000 1,485 - 221 October, . 22,043 2,043 1,095,000 1,670 600,000 228 November, 32,897 1,570 1,811,000 1,420 409,000 210 Total for the year, 223,465 45,296 16,314,000 15,345 1,009,000 2,307](https://iiif.wellcomecollection.org/image/b28121053_0113.jp2/full/800%2C/0/default.jpg)