[Report 1937] / School Medical Officer of Health, Cambridgeshire County Council.
- Cambridgeshire (England). County Council.
- Date:
- 1937
Licence: Attribution 4.0 International (CC BY 4.0)
Credit: [Report 1937] / School Medical Officer of Health, Cambridgeshire County Council. Source: Wellcome Collection.
7/48 (page 5)
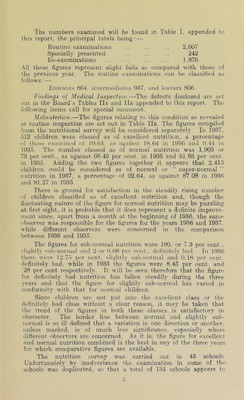
![The numbers examined will be found in Table I, appended to this report, the principal totals being: — Routine examinations ... ... ... 2,607 Specially presented ... ... ... 242 lie-examinations ... ... ... ... 1,876 .\11 these figures represent slight falls us compared with those of the previous year. The routine examinations can be cla.ssitied as follows: — Entrants 864, intermediates 937, and leavers 806. Fhulings of Medical Inspection.—The defects disclosed are set out in the Board’s Tables IL\ and IIh appended to this report. 'I’he following items call for special comment. Malnutrition.—The figures relating to this condition as revealed at routine inspection are set out in Table IIb. The figures compiled fiom the nutritional survey will be considered separately. In 1937, r)12 children were classed as of excellent nutrition, a percentage of those examined <jf 19.6-1. as against 1(8.64 in 1936 a)id 9.44 in 1935. The number classed as of normal nutrition was 1,903 or 73 per cent., as against 68.43 per cent, in 1936 and 81.83 per cent, in 1935. Adding the two figures together it appears that 2,415 (jhildren could be considered as of normal or “ super-normal ” nutrition in 1937, a percentage of 92.64, as against 87.08 in 1930 and 91.27 in 1935. There is ground for satisfaction in the steadily rising number of children classified as of excellent nutrition and, though the fluctuating nature of the figure for normal nutrition may be puzzling at first sight, it is probable that it does represent a definite improve- ment since, apart from a month at the beginning of 1936, the same observer was responsible for the figures for the years 1936 and 1937, \\hile different observers were concerned in the comparison between 1936 and 1935. The figures for sub-normal nutrition were 190, or 7.3 per cent., lightly sub-normal find 2 oi-0.08 ])er coni., defijiitely bad. In 1936 tho-re wei-c 12.75 ])er cent, slightly sub-normal and 0.18 per cent, definitely bad. while in 1935 the figures were 8.45 per cent, and .28 per cent respectively. It will be seen therefore that the figure for definitely bad nutrition has fallen steadily during the three years and that the figure for slightly sub-normal has varied in conformity with that for normal children. Since children are not put into the excellent class or the definitely bad class without a clear reason, it may be taken that the trend of the figures in both these classes is satisfactory in character. The border line between normal and slightly sub- normal is so ill defined that a variation in one direction or another, unless marked, is of much less significance, especially where different observers are concerned. As it is, the figure for excellent and normal nutrition combined is the best in any of the three years for which comparative figures are available. The nutrition survey was carried out in 45 schools. L’nfortuuate'ly by inadvertence the examination in some of the schools was duplicated, so that a total of 134 schools appears to](https://iiif.wellcomecollection.org/image/b29089050_0007.jp2/full/800%2C/0/default.jpg)