Ophthalmia neonatorum : the problem after thirty years of statutory notification and sixty years of Credé prophylaxis / Arnold Sorsby.
- Arnold Sorsby
- Date:
- 1945
Licence: In copyright
Credit: Ophthalmia neonatorum : the problem after thirty years of statutory notification and sixty years of Credé prophylaxis / Arnold Sorsby. Source: Wellcome Collection.
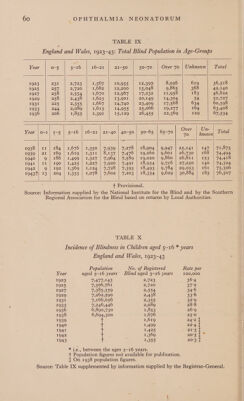
64/76 page 60
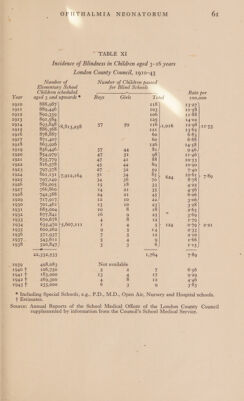
![TABLE IX England and Wales, 1923-43: Total Blind Population in Age-Groups Year o-5 5-16 16-21 21-50 50-70 Over 70 | Unknown| Total 1923 231 257236) 1,507 10,955 i 12,307 8,026 619 36,518 1925 257 220 1,682 12,200 15,048 9,865 368 42,140 1927 258 2,554 1,670 12,967 17,232 11,958 183 46,822 1929 258 | 2,438 | 1,623 | 13,901 |. 20;149 | - 14,304 54 52,727 1931 225 2,355 | 1,667 | 14,740 | 23,409 | 17,568 634 60,598 1933 244 | 2,089 | 1,613 | 14,955 | 25,066 | 19,277 164 63,408 1936 206 1,855 | 1,391 15,129 | 26,455 | 22,369 129 67,534 Year |o-1| 1-5 | 5-16 | 16-21 | 21-40 | 40-50 | 50-65 | 65-70 Over eiee, 70 Rnown Total 1938 | 11 | 184 | 1,676 | 1,350 | 7,939 | 7,278 |.18,904 | 9,247 | 25,141 | 147 | 71,875 1939 | 21 | 169 | 1,619 | 1,311 | 8,137 | 7,476 | 19,260 | 9,601 | 26,730 | 168 | 74,494 1940 | 9 | 186 | 1,499 | 1,327 | 7,964 | 7,589 | 19,020 | 9,860 | 26,811 | 153 | 74,418 1941 | IX | 190 | 1,425 | 1,227 | 7,920 | 7,491 | 18,954 | 9,716 | 27,250 | 140 | 74,324 1942 | 9 | 192 | 1,369 | 1,124 | 7,728 | 7,393 | 18,493 | 9,784 | 29,053 | 161 | 75,306 1943T| 13°] 204 | 1,355 | 1,078 | 7,602 | 7,203 | 18,354 | 9,629 | 30,884 | 185. | 76,507 + Provisional. Source: Information supplied by the National Institute for the Blind and by the Southern Regional Association for the Blind based on returns by Local Authorities. TABLE X Incidence of Blindness in Children aged 5-16 * years England and Wales, 1923-43 Population No. of Registered Rate per Year aged 5-16 years’ Blind aged 5-16 years 100,000 1923 7,477,143 2,723 36°4 1925 7,306,761 2,720 37°2 1927 7,385,359 . 2,554 34°6 1929 7,262,590 2,438 33°6 1931 7,166,056 25355 Deki) 1933 7,246,446 2,089 283 1936 6,890,730 1,853 26°9 1938 6,694,300 1,676 25°0 1939 1 1,619 24'2 f 1940 Tt 1,499 22°4 | 1941 T 1,425 213] 1942 t 1,369 20°5{~ 1943 t 1,355 20°3 I 2 i.e., between the ages 5-16 years. + Population figures not available for publication. ft On 1938 population figures. Source: Table [X supplemented by information supplied by the Registrar-General.](https://iiif.wellcomecollection.org/image/b32843677_0064.jp2/full/800%2C/0/default.jpg)