Licence: Attribution-NonCommercial-NoDerivatives 4.0 International (CC BY-NC-ND 4.0)
Credit: Blood groups in man / by R.R. Race and Ruth Sanger. Source: Wellcome Collection.
41/324 page 21
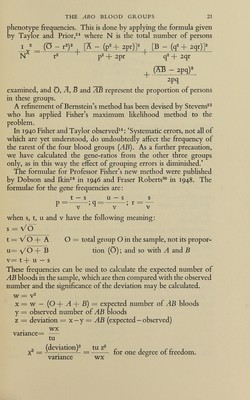
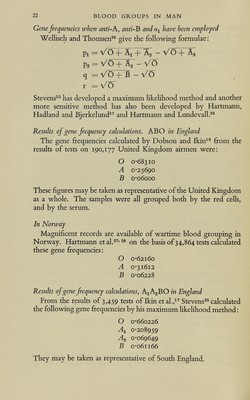
![THE ABO BLOOD GROUPS 21 phenotype frequencies. This is done by applying the formula given by Taylor and Priorwhere N is the total number of persons I ^ _ (O — r^)^ [A — (p^ + 2pr)]^ [B — (q^ + 2qr)]^ r^ p^ + 2pr q^ + 2qr 2pq examined, and Ö, Ä, Б and ЛВ represent the proportion of persons in these groups. A refinement of Bernstein's method has been devised by Stevens^® who has applied Fisher's maximum likelihood method to the problem. In 1940 Fisher and Taylor observed^^ : 'Systematic errors, not all of which are yet understood, do undoubtedly affect the frequency of the rarest of the four blood groups (AB). As a further precaution, we have calculated the gene-ratios from the other three groups only, as in this way the effect of grouping errors is diminished.' The formulae for Professor Fisher's new method were published by Dobson and Ikin^® in 1946 and Fraser Roberts^ in 1948. The formulae for the gene frequencies are: t — s u — s s p = ; q == ; r = — V V v when s, t, u and v have the following meaning: s = VÖ t^VO+A 0 = total group О in the sample, not its propor¬ ne- \/0 + В tion (O) ; and so with A and В v= t + u — s These frequencies can be used to calculate the expected number of AB bloods in the sample, which are then compared with the observed number and the significance of the deviation may be calculated. w — x=w - (0+Л+Б) — expected number of ÄB bloods y = observed number of AB bloods z = deviation = x—y = AB (expected — observed) wx variance= tu „ (deviation)^ tu , r r 1 X = ^ — — tor one degree or rreedom. variance wx](https://iiif.wellcomecollection.org/image/b18023964_0042.JP2/full/800%2C/0/default.jpg)
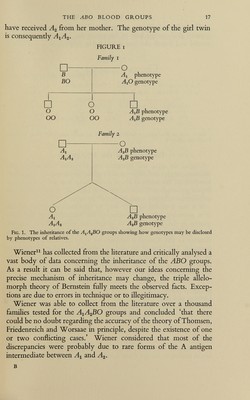
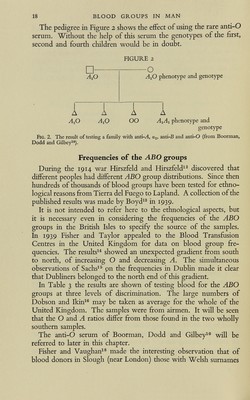
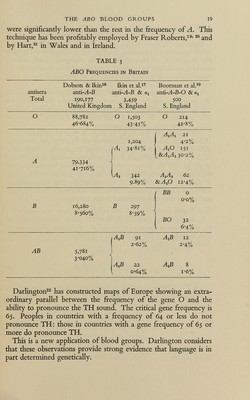
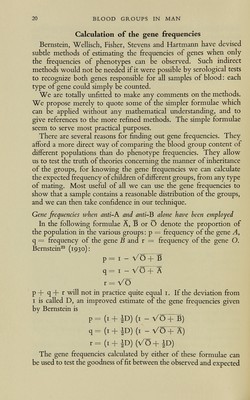
 No text description is available for this image
 No text description is available for this image
 No text description is available for this image