The eleventh annual report of the committee of management of the Metropolitan Imbecile Asylum, Caterham, Surrey : 1881.
- Metropolitan District Asylum at Caterham
- Date:
- 1882
Licence: Public Domain Mark
Credit: The eleventh annual report of the committee of management of the Metropolitan Imbecile Asylum, Caterham, Surrey : 1881. Source: Wellcome Collection.
27/58 (page 23)
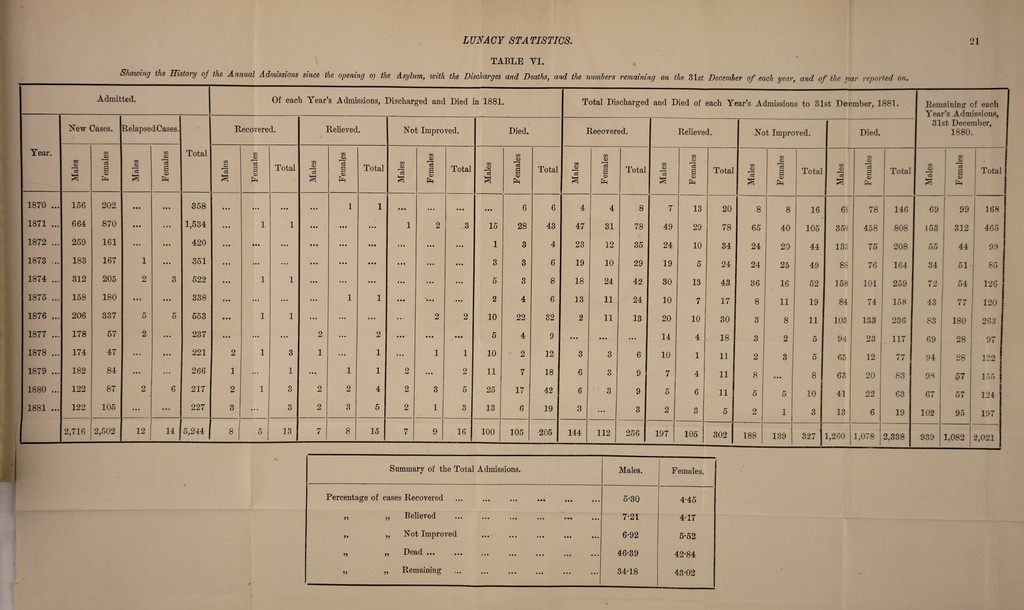
![TABLE VI. Showing the History of the Annual Admissions since the opening oj the Asylum, with the Discharges and Deaths, and the numbers remaining on the 3ls£ December of each year, and of the par reported on. Admitted. Of each Year’s Admissions, Discharged and Died in 1881. Total Discharged and Died of each Year’s Admissions to 31st Deeember, 1881. Remaining of each Year’s Admissions, 31st December, 1880. Year. New Cases. Relapsed Cases. Total Recovered. Relieved. Not Improved. Died. Recovered. Relieved. Not Improved. Died. Males Females Males Females Males Females Total Males TJ1 rSi a <D Total Males Females Total Males Females Total Males Females Total Males Females Total Males Females Total Males F e m ales Total CO o --- Females — Total 1870 ... 156 202 • • • • • • 358 • * • • • • • • • 4 • • 1 1 • 4 4 4 4 4 4 4 4 4 4 4 6 6 4 4 8 7 13 20 8 8 16 6] 78 146 69 99 168 1871 ... 664 870 • • • • • • 1,534 • • • 1 1 4 4 4 4 4 4 4 4 4 1 2 .3 15 28 43 47 31 78 49 29 78 65 40 4 105 350 458 808 153 312 465 1872 ... 259 161 • • • • • • 420 • t • • • 4 • • • • 4 4 4 4 4 • •• 4 4 4 4 4 4 4 4 4 1 3 4 23 12 35 24 10 34 24 20 44 133 75 208 55 44 99 1873 ... 183 167 1 • • • 351 • • • • • • ... 4 4 4 4 4 4 • 4 4 4 4 4 4 4 4 4 4 4 3 3 6 19 10 29 19 5 24 24 25 49 88 76 164 34 51 85 1874 ... 312 205 2 3 522 • • • 1 1 4 4 4 4 4 4 4 4 4 4 4 4 * 4 4 4 4 4 5 3 8 18 24 42 30 13 43 36 16 52 158 101 259 72 54 126 1875 ... 158 180 • •i • • • 338 • • • ... • • • 4 4 4 1 1 4 4# 4 4 4 4 4 4 2 4 6 13 11 24 10 7 17 8 11 19 84 74 158 43 77 120 1876 ... 206 337 5 5 553 • • • 1 1 4 4 4 4 4 4 4 4 4 ... 2 2 10 22 32 2 11 13 20 10 30 3 8 11 103 133 236 S3 180 263 1877 ... 178 57 2 237 • • • • • • it* 2 4 4 4 2 4 4 4 4 0 4 • • • 5 4 9 4 4 4 4 4 4 4 4 4 14 4 18 3 2 5 94 23 117 69 28 97 1878 ... 174 47 • • • • M 221 2 1 3 1 4 4 4 1 4 4 4 1 1 10 2 12 3 3 6 10 1 11 2 3 5 65 12 77 94 28 122 1879 ... 182 84 • • • ... 266 1 ... 1 4 4 4 1 1 2 4 4 4 2 11 7 18 6 3 9 7 4 11 8 4 4 4 8 63 20 83 98 57 10 o 1880 ... 122 87 2 6 217 2 1 3 2 2 4 2 3 5 25 17 42 6 3 9 5 6 11 5 5 10 41 22 63 67 57 124 1881 ... 122 105 • • • e • • 227 3 • • • 3 2 3 5 2 1 3 13 6 19 3 4 4 4 3 2 3 5 2 1 3 13 6 19 102 95 197 2,716 2,502 12 14 5,244 8 5 13 7 8 15 7 Q 16 100 105 205 144 112 256 197 105 302 188 139 327 1,260 1,078 2,338 939 1,082 2,021 Summary of the Total Admissions. Males. Females. Percentage of cases Recovered . 5-30 4-45 „ Relieved ... ... ... ... ... ... 7-21 4-17 „ „ Not Improved ... . 6-92 5-52 ?? >> Dead ... ... ... ... ... ... ... 46-39 42-84 „ „ Remaining . 34-18 43-02](https://iiif.wellcomecollection.org/image/b3030961x_0027.jp2/full/800%2C/0/default.jpg)