Forty-seventh annual report of the managers of the State Lunatic Asylum at Utica, for the year ending Sept. 30, 1889 : transmitted to the legislature March, 1890 / New York State Lunatic Asylum.
- New York (State). State Lunatic Asylum
- Date:
- 1890
Licence: Public Domain Mark
Credit: Forty-seventh annual report of the managers of the State Lunatic Asylum at Utica, for the year ending Sept. 30, 1889 : transmitted to the legislature March, 1890 / New York State Lunatic Asylum. Source: Wellcome Collection.
25/66 page 25
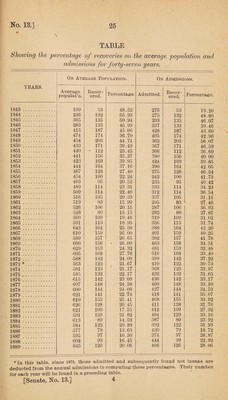
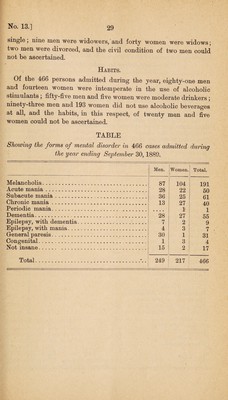
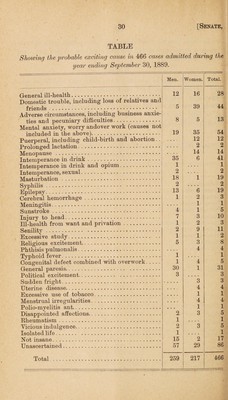
![No. 13.] \ 25 TABLE Showing the 'percentage of recoveries on the average population and admissions for forty-seven years. YEARS. On Avebage Population. On Admissions. Average populat’n. Recov¬ ered. Percentage. Admitted. Recov¬ ered. Percentage. 1843 .. 109 53 48.52 276 53 19.20 1844 .. 236 132 55.93 275 132 48.80 1845 . 365 135 50.94 293 135 46.07 1846 .. 283 133 46.99 337 133 39.46 1847 . 415 187 45.06 428 187 43.60 1848 . 474 174 36.70 405 174 42.96 1849 . 454 203 44 71 362 203 56 07 1850 ... 433 171 39.49 367 171 46.59 1851. 440 • 112 23 45 366 112 36 00 1852 . 441 156 35.37 390 156 40 00 1853 .. 423 169 39.95 424 169 39.85 1854 .. . 444 164 37.16 390 164 42.05 1855 . 467 128 27.40 275 128 46.54 1856 . 454 100 22.24 242 100 41.73 1857 . 463 95 20.52 235 95 40.42 1858 ... 489 114 23.31 333 114 34.23 1859 . 509 114 22.40 312 114 36.54 1860 .. 516 105 20.33 337 105 31.15 1861 ... 519 83 15.99 295 83 27.46 1862 . 526 106 20.15 287 106 36.93 1863 . 528 80 15.15 282 80 27.87 1864 .. 560 109 19.46 319 109 31.02 1865 .. 591 113 18.95 356 113 31.74 1866 ... 643 164 25.50 388 164 42.26 1867 . 610 159 26.00 401 159 40.25 1868 . 589 157 26.65 382 157 41.78 1869 . 600 156 • 26.00 463 156 34.51 1870 . 629 153 24.32 481 153 32.48 1871 .... 605 168 27.76 516 168 33.40 1872 . 588 142 24.00 399 142 37.22 1873 *. 563 122 21.67 410 122 30.73 1874 . 581 123 21.17 368 123 33.97 1875 . 585 132 22.17 432 132 31.65 1876 .. 615 142 23.09 436 142 33.17 1877 . 607 148 24.38 460 148 33.10 1878 ... 600 144 24.00 427 144 34.53 1879 . 621 141 22.74 418 141 35.07 1880 ... 610 155 25.41 468 155 33.92 1881.. 626 128 20.45 411 128 31.76 1882 . 621 109 17.55 412 109 27.32 1883 . 591 129 21.82 404 129 33.16 1884 ... 613 89 14.52 387 89 23.92 1885 . 584 122 20.89 392 122 31.93 1886 . 577 79 13.69 430 79 18.72 1887 .. 595 97 16.30 374 97 26.87 1888 ... 602 99 16.45 444 99 22.92 1889 . 645 126 20.06 466 126 28.06 *In this table, since 1873, those admitted and subsequently found not insane are deducted from the annual admissions in computing these percentages. Their number for each year will be found in a preceding table. [Senate, No. 13.] 1](https://iiif.wellcomecollection.org/image/b30317691_0025.jp2/full/800%2C/0/default.jpg)