[Report of the Medical Officer of Health for London County Council 1898].
- London County Council (London, England). County of London.
- Date:
- [1899?]
Licence: Attribution-NonCommercial 4.0 International (CC BY-NC 4.0)
Credit: [Report of the Medical Officer of Health for London County Council 1898]. Source: Wellcome Collection.
19/274 (page 7)
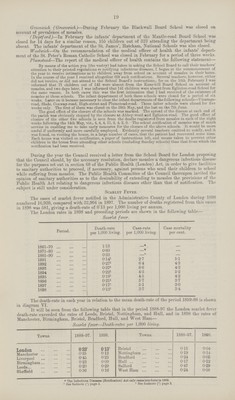
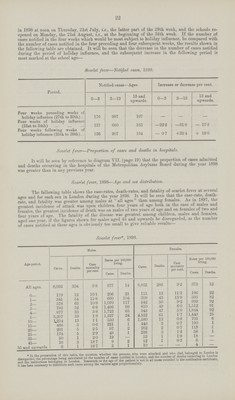
![7 This table shews, therefore, that during the period 1891-8, as compared with the decennium 1881-90, there has been a mean annual saving of 4,161 lives, and this represents a mean annual saving of 161,331 years of life capital. In previous annual reports I have similarly dealt with the mortality figures of the periods 1891-4, 1891-5, 1891-6 and 1891-7, and it is interesting to compare the results obtained in the five periods, viz.:— Table III. Periods compared with 1881-90. Mean annual number of lives gained. Mean annual amount of life capital aineu. Proportion of life cap] al gained to etch life gain d. years. years. 1891-4 1,042 79,606 76,4 1891-5 1,304 85,519 65,6 1891-6 2,461 104,742 42,6 1891-7 3,587 142,460 39,7 1891-8 4,161 161,331 38,8 It will thus be seen that the mean annual number of lives saved has increased in each period, while the amount of life capital in proportion to the number of lives saved has decreased, this decrease being particularly marked in the periods 1891-6, 1891-7 and 1891-8. In my last annual report I discussed these facts in some detail, and published an analysis of the mortality figures for the period 1891-4, and each of the years 1895, 1896 and 1897, showing that the large proportion of life capital gained to each life gained in the period 1891-4 was somewhat exceptional, and that the successive addition of the facts for the years 1895, 1896 and 1897 caused a decline in the proportion of life capital gained in the periods 1891-5, 1891-6 and 1891-7. The following tables (IV., V. and VI.) are constructed on lines similar to those published in my last annual report, with the addition of the figures for 1898. Bearing in mind the fact that the amount of life capital '* saved is not proportionate to the number of lives saved, but is dependent also upon the ages of the lives saved, these tables furnish the material for estimating the effect of the successive addition of the figures relating to the years 1895, 1896, 1897 and 1898, to those of the period 1891-4,* and the decreasing proportion of life capital gained to each life gained in the periods 1891-5, 1891-6, 1891-7, and 1891-8, shown in Table III. may thus be more clearly appreciated. * It should be pointed out that all figures relating to the period 1891-4 are mean annual, Table IV. Age-period. Death rates per 1,000 living. Increase or decrease per cent. (compared with ceath ra es in 1881-90). 1891-4. 1895. 1896. 1897. 1898. 1891-4. 1895. 1896. 1897. 1898. Males All ages 2153 21.00 19.90 19.58 20.05 — 2.6 — 5.0 — 100 — 11 4 — 9-3 0— 70.87 72.72 71.30 65.63 68.95 — 3.0 — 0.5 — 2.4 — 10.2 — 5-7 5— 5.46 4-51 5.47 4.37 4.16 — 7.9 — 23.9 — 7.8 — 26.3 — 29-8 10— 2.63 2.52 2.43 2.47 2.01 — 9.9 — 13.7 — 16.8 — 15.4 — 31.2 15— 3.90 3.39 3.39 3.38 3.17 — 3.7 — 16.3 —. 16.3 — 16.5 — 21.7 20— 5.06 4.67 4.59 4.66 4.71 — 7.0 — 14.2 — 15.6 — 143 — 13.4 25— 8.08 7.59 6'94 7.03 7.20 — 6.6 — 12.3 — 19.8 — 18.7 — 16.8 35— 15.23 13.45 12.99 14.07 13.71 † 1.8 — 10.1 — 13.2 — 5.9 — 8.4 45— 24.61 23.21 20.86 22.54 22.48 + 31 — 2.8 — 12. 6 — 5.6 — 5.8 55— 43.15 41.87 37.10 39.87 41.74 4. 4 + 1.3 — 10.2 — 3.5 + 1.0 65— 80.58 76.92 67.15 67.90 68.16 + 33 — 1.3 — 13.9 — 12.9 — 12.6 75— 156.05 160.08 143.38 148.83 155.96 + o.1 + 2.7 — 8.0 — 4.6 + o.o 85 and 288.41 288.99 232.81 256.25 269.35 — 31 — 2.9 — 21.8 — 139 — 9.5 upwards Age.period. Death rates per 1,000 living. Incrtase or decrease per cent. (compared with death rates in 1881-90). 1891-4. 1895. 1896. 1697. 1898. 1891-4. 1895. 1896. 1897. 1898. Females All ages 18.46 18.23 16.83 16.27 16.80 — 2.0 — 3.2 — 10.6 — 13.6 — 10.8 0— 60.96 62.10 62.07 55.69 58.78 — 3.6 — 1.8 — 1.9 — 12.0 — 71 5— 5.72 4.79 5.36 4.58 4.08 — 1.7 — 17.7 — 7.9 — 21.3 — 29.9 10— 2.66 2.57 2.42 2.25 212 — 8.0 — 11.1 — 16.3 — 22.1 — 26.6 15— 3.32 2.94 2.82 2.77 2.63 — 7.3 — 17.9 — 21.2 — 22.6 — 26.5 20— 4.01 3.72 3.13 316 3.14 — 8.9 — 15.5 — 28.9 — 28.2 — 28.6 25— 6.33 5.77 5.41 5.30 5.26 — 7.2 — 15.4 — 20.7 — 22.3 — 22.9 35— 11.41 10.59 10.41 10.40 994 — 01 — 7.3 — 8.8 — 8.9 — 13.0 45— 17.53 17.03 15.34 15.86 16.59 + 1.7 — 1.2 — 110 — 8.0 — 3.7 55— 32.44 31.83 26.83 27.51 29 05 + 5.4 + 3.4 — 12.8 — 10.6 — 5.6 65— 65.80 6413 50.17 52.93 55.55 + 4.0 + 1.3 — 20.7 — 16.4 — 12.2 75— 136.60 146.18 117.59 12315 132.23 + 1.7 + 8.9 — 12.4 — 8.3 — 1.5 85 and 260.67 278.84 231.82 262.79 254.14 — 1.5 + 5.3 — 12.4 — 0.7 — 40 upwards](https://iiif.wellcomecollection.org/image/b18252473_0019.jp2/full/800%2C/0/default.jpg)