[Report of the Medical Officer of Health for London County Council 1898].
- London County Council (London, England). County of London.
- Date:
- [1899?]
Licence: Attribution-NonCommercial 4.0 International (CC BY-NC 4.0)
Credit: [Report of the Medical Officer of Health for London County Council 1898]. Source: Wellcome Collection.
21/274 (page 9)
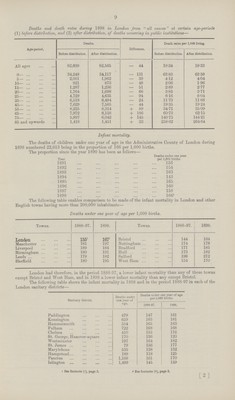
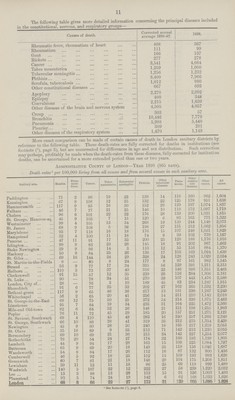
![9 Deaths and death rates during 1898 in London from all causes at certain age-periods (1) before distribution, and (2) after distribution, of deaths occurring in public institutions— Age-period. Deaths. Death rates per 1,000 living. Before distribution. After distribution. Difference. Before distribution. After distribution. All ages 82,609 82,565 — 44 18.34 18.33 0— 34,248 34,117 — 131 63.83 63.59 5 — 2,001 1,962 — 39 4.12 4.04 10— 921 873 — 48 2.06 1.96 15— 1,287 1,236 — 51 2.89 2.77 20— 1,764 1,698 — 66 3.85 3.71 25— 4,729 4,635 — 94 6.16 6.04 35— 6,518 6,494 — 24 11.73 11.68 45— 7,629 7,585 — 44 19.35 19.24 55— 8,225 8,314 + 89 34.71 35.09 65— 7,972 8,158 + 186 60.73 62.15 75— 5,897 6,042 + 145 140.75 144-21 85 and upwards 1,418 1,451 + 33 258.62 264-64 The proportion since the year 1890 has been as follows— Deaths under one year Tear. per 1,000 births. 1891 153 1892 154 1893 163 1894 143 1895 165 1896 160 1897 158 1898 1661 Infant mortality. The deaths of children under one year of age in the Administrative County of London during 1898 numbered 22,013 being in the proportion of 166 per 1,000 births. The following table enables comparison to be made of the infant mortality in London and other English towns having more than 200,000 inhabitants— Deaths under one year of age per 1,000 births. Towns. 1888-97. 1898. Towns. 1888-97. London 1552 167 Bristol 144 164 Manchester 185 197 Nottingham 174 178 Liverpool 189 184 Bradford 171 185 Birmingham 180 191 Hull 173 182 Leeds 178 182 Salford 198 212 Sheffield 180 195 West Ham 154 170 London had therefore, in the period 1888-97, a lower infant mortality than any of these towns except Bristol and West Ham, and in 1898 a lower infant mortality' than any except Bristol. The following table shows the infant mortality in 1898 and in the period 1888-9/ in each of the London sanitary districts— Sanitary district. Deaths under one year of pge. Deaths under one year of age per 1,000 births. 1888-97. 1898. Paddington 479 147 161 Kensington 659 165 181 Hammersmith 554 165 183 Fulham 722 168 168 Chelsea 410 155 176 St. George, Hanover-square 170 136 120 Westminster 197 164 182 St. James 79 156 177 Marylebone 535 138 132 Hampstead 189 118 125 Pancras 1,168 161 170 Islington 1,499 145 159 1 See footnote (i), page 3. s See footnote ('), page 3. [2]](https://iiif.wellcomecollection.org/image/b18252473_0021.jp2/full/800%2C/0/default.jpg)