Annual report of the Department of Public Health / Union of South Africa.
- South Africa. Department of Health
- Date:
- [1943]
Licence: Public Domain Mark
Credit: Annual report of the Department of Public Health / Union of South Africa. Source: Wellcome Collection.
17/24 (page 15)
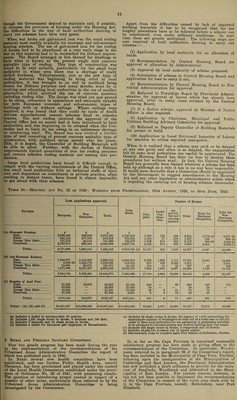
![]5 aothercraft. Neo-natal deaths, those occuring during the irst month, are, as in other countries, largely due to pre¬ maturity, congenital debility and birth injuries. Many of hese deaths could be prevented by better pre-natal care, letter midwifery and better post-natal services. Thus, ,lthough the lower infantile mortality rate is a matter for atisfaction, there is still much scope for improvement. The death rate among Asiatic infants is very considerably ligher than that among Europens while the mortality among Coloured children, as reflected in the table, is extremely high, 'here is some doubt, however, whether the figures for Coloureds can be regarded as entirely accurate as it seems lossible that registration of births among this class of the Table 25.—European Infants : Births and Deaths unde Death Rate per 1,000 community is still somewhat incomplete, a factor which would exaggerate the infantile mortality rate. Courses for the training of non-European health visitors are being conducted by the Technical Colleges at both Cape Town and Johannesburg this year. Similar courses have previously been run at Cape Town on three occasions. The Department wishes to encourage the training and employment of more non-European health visitors who can do very valuable work among their own people. With this object in view the Department gives a grant to the Trained Nurses Association which selects suitable candidates whom it assists financially by the payment of fees, living and other expenses. The trainees are expected to contribute towards the course. One Year Registered and Infantile Mortality Rate, i.e ive Births, 1919-1942. Year. Cape. Natal. Transvaal. Orange Free State. Union. — Total European Births Registered. Deaths of European Children under One Year. Death-rate per 1,000 Births. Total European Births Registered. Deaths of European Children under One Year. Death-rate per 1,000 Births. Total European Births Registered. Deaths of European Children under One Year. Death-rate per 1,000 Births. Total European Births Registered. Deaths of European Children under One Year. Death-rate per 1,000 Births. Total European Births Registered. Deaths of European Children under One Year. Death-rate per 1,000 Births. 919. 16,749 1,351 80-66 2,910 191 65-64 15,338 1,326 86-45 4,727 382 80-81 39,724 3,250 81-81 920. 18,425 1,654 89-77 3,256 235 72-17 16,768 1,576 93-99 4,996 448 89-67 43,445 3^913 90-07 921. 18,062 1,382 76-51 3,370 203 60-24 16,582 1,374 82-86 5,288 379 71-67 43,302 3*338 77-09 922. 18,248 1,294 70-91 3,294 180 54-64 16,370 1,292 78-92 4,920 357 72-56 42,832 3j23 72-91 923. 18,296 1,353 73-95 3,229 197 61-01 15,619 1,261 80-74 5,037 328 65-12 42,181 3,139 74-42 924. 18,730 1,296 69-19 3,410 273 80-06 15,287 1,171 76-60 4,919 382 77-66 42,346 3*122 73-73 925. 18,366 1,343 73-12 3,509 206 58-71 16,348 1,059 64-78 6,188 361 69-58 43,411 2,969 68-39 926. 18,675 1,196 64-04 3,588 189 52-68 16,304 1,186 72-74 5,309 273 51-42 43,876 2,844 64-82 927. 18,537 1,293 69-75 3,435 166 48-32 17,050 1,359 79-71 5,325 314 68-97 44,347 3,132 70-63 928. 18,032 1,240 68-77 3,514 184 52-36 17,949 1,370 76-33 5,318 365 68-63 44,813 3J59 70-49 929. 19,008 1,169 I- 61-60 3,650 177 48-49 18,227 1,342 73-63 5,334 280 52-49 46,219 2j968 64-22 930. 19,468 1,332 68-37 3,641 159 43-65 19,108 1,386 72-54 5,317 300 56-42 47,534 3,177 66-84 931. 19,180 1,182 61-63 3,538 162 45-79 18,733 1,267 67-65 4,975 317 63-72 46,423 2,928 63-07 932. 18,284 1,205 65-90 3,373 204 60-48 18,376 1,402 76-30 4,911 271 55-18 44,944 3,082 68-57 93L. 17,931 995 54-49 3,441 166 48-24 18,452 1,266 68-61 4,695 299 63-68 44,519 2,716 61-01 934?. 17,642 1,022 57-93 3,310 157 47-43 19,327 1,279 66-18 4,599 270 58-71 44,878 2,728 60-79 935. 18,242 1,016 55-70 3,441 167 48-53 21,109 1,537 72-81 4,925 277 56-24 47,717 2,997 62-81 936. 18,162 980 53-96 3,606 189 52-41 22,192 1,454 65-52 4,670 249 53-32 48,630 2,872 59-06 937. 18,404 1,012 54-99 3,766 175 46-47 23,814 1,439 60-43 4,894 252 51-49 50,878 2,878 56-57 938. 18,727 962 51-37 3,886 193 49-67 24,568 1,322 53-81 4,884 214 43-82 52,065 2,691 51-69 939. 19,022 984 51-73 4,056 151 37-23 25,795 1,304 50-55 4,644 209 45-00 53,517 2,648 49-48 940. 19,091 872 45-68 4,218 224 53-11 26,383 1,431 54-24 4,747 198 41-71 54,439 2,725 50-06 941. 19,026 884 46-46 4,361 180 41-27 26,711 1,481 55-74 4,471 226 50-55 54,569 2,779 60-93 942. 19,422 958 49-38 4,445 202 45-44 27,615 1,298 47-00 4,661 212 45-48 56,143 2,670 47-52 Pable 26.—Infantile Mortality : Asiatics and Mixed, 1942. Table 27.—Maternal Mortality : Europeans. Province. Asiatics. Mixed and other Coloured. Live Births. Infantile Deaths. Rate per 1,000 Births'. Live Births. Infantile Deaths. Rate per 1,000 Births. ape. fatal. ’ransvaal. )range Free State.. Union. 392 8,370 1,500 38 734 135 96-94 87-69 90-00 33,814 810 1,728 279 5,994 85 332 61 177-26 104•94 192-13 218-64 10,262 907 88-38 36,631 6,472 176-68 >. Maternal Welfare. Table 27 shows that the European maternal mortality rate has increased slightly this year from the figure of last year, B’hich was much the lowest ever recorded in the Union. It is particularly in regard to deaths due to puerperal sepsis that a considerable reduction has taken place during the last few years. Of 56,143 European births during the year 20,131 took place in institutions representing 35-9 per cent. It is noteworthy that the percentage of European births in institutions has increased very markedly during the last decade. In 1932 only 6,816 or 15-2 per cent, of such births took place in institutions. It seems highly probable that this is an important factor in the reduction of the maternal mortality rate which has occurred during this period. Table 28 indicates that the maternal mortality rates for Asiatics and Coloureds, and particularly the former, are not nearly as satisfactory as that for Europeans. Supervision of midwives in the smaller urban areas still leaves much to be desired although there has been a slight improvement in the keeping of the lists of midwives. The Department does not recommend the listing of untrained midwives but local authorities still find it necessary to permit them to practise especially among non-Europeans. This might not be necessary if more local authorities would establish district nursing and midwifery services in their areas. At Present only 23 maintain such services for non-Europeans and only 2 maintain them for Europeans. The total number of areas prescribed in terms of section thirty-nine (b) of the Medical, Dental and Pharmacy Act is 5, no areas haying been prescribed during the year. The midwifery regulations were applied to the Divisional Council area of Tulbagh during the year. Year. Live Births Registered. Deaths due to Puerperal Causes. Number. Rates per 1,000 Live Births. Puerperal Sepsis. Other Puerperal Causes. Puerperal Sepsis. Other Puerperal Causes. Total Puerperal Mortality. 1926... 43,876 88 112 2-06 2-50 4-56 1927... 44,347 101 112 2-28 2-53 4-81 1928... 44,809 102 121 2-28 2-70 4-98 1929... 46,219 140 103 3-03 2-23 5-25 1930... 47,536 119 131 2-50 2-76 5-26 1931... 46,423 116 102 2-50 2-20 4-70 1932... 44,944 126 113 2-80 2-51 6-31 1933... 44,519 113 101 2-54 2-27 4-81 1934... 44,878 121 148 2-69 3-30 5-99 1935... 47,717 119 107 2-49 2-24 4-73 1936... 48,630 116 132 2-39 2-71 5-10 1937... 50,878 99 124 1-94 2-44 4-38 1938... 52,065 78 114 1-50 2-19 3-69 1939... 53,517 69 124 1-29 2-32 3-61 1940... 54,439 67 116 1-23 2-13 3-36 1941... 54,569 46 90 0-84 1-65 2-49 1942... 56,143 60 99 1-07 1-76 2-83 Table 28.—Maternal Mortality : Asiatics and Mixed— Union. Deaths due to Puerperal Causes. Year. Live Birth3 Registered. Number. Rates per 1,000 Live Births. Puerperal Sepsis. Other Puerperal Causes, Puerperal Sepsis. Other Puerperal Causes. Total Puerperal Mortality. Asiatics. 1940... 9,531 16 37 1-68 1941... 9,841 16 44 1-63 1942... 10,262 26 40 2 * 53 Mixed and otheb Coloured. 1940... 38,366 81 129 2-11 1941... 38,412 88 121 2-29 1942... 36,631 57 111 1-56 3- 88 4- 47 3-90 3-30 315 3 03 5- 56 610 6- 43 5-47 5-44 4-59](https://iiif.wellcomecollection.org/image/b31477240_0017.jp2/full/800%2C/0/default.jpg)