Annual report on the work of the Ministry of Public Health / Egypt.
- Egypt. Wizārat al-Ṣiḥḥah al-ʻUmūmīyah.
- Date:
- [1927]
Licence: Public Domain Mark
Credit: Annual report on the work of the Ministry of Public Health / Egypt. Source: Wellcome Collection.
12/304 (page 2)
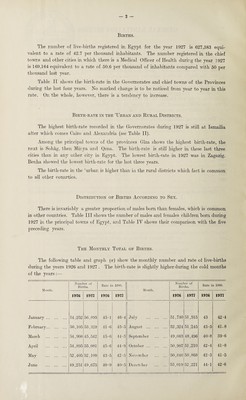
![Births. The number of live-births registered in. Egypt for the year 1927 is 627,583 equi¬ valent to a rate of 42.7 per thousand inhabitants. The number registered in the chief towns and other cities in which there is a Medical Officer of Health during the year ]927 is 169,164 equivalent to a rate of 50.6 per thousand of inhabitants compared with 50 per thousand last year. Table II shows the birth-rate in the Governorates and chief towns of the Provinces during the last four years. No marked change is to be noticed from year to year in this rate. On the whole, however, there is a tendency to increase. Birth-rate in the Urban and Rural Districts. The highest birth-rate recorded in the Governorates during 1927 is still at Ismailia after which comes Cairo and Alexandria (see Table II). Among the principal towns of the provinces Giza shows the highest birth-rate, the next is Sohag, then Mir.ya and Qena. The birth-rate is still higher in these last three cities than in any other city in Egypt. The lowest birth-rate in 1927 was in Zagazig. Benha showed the lowest birth-rate for the last three years. The birth-rate in the 'urban is higher than in the rural districts which fact is common to all other counrties. Distribution of Births According to Sex. There is invariably a greater proportion of males born than females, which is common in other countries. Table III shows the number of males and females children born during 1927 in the principal towns of Egypt, and Table IV shows their comparison with the five preceding years. The Monthly Total of Births. The following table and graph (n) show the monthly number and rate of live-births during the years 1926 and 1927 . The birth-rate is slightly higher during the cold months of the years :— Month. Number of Births. Rate in 1000. Month. Number of Births. Rate in 1000. 1926 1927 1926 1927 1926 1927 1926 1927 January . 54,252 56,893 45-1 46-4 July . 51,740 51,915 43 42*4 February. 50,105 53,328 41-6 43-5 August . 52,324 51,245 43-5 41.8 March . 54,908 45,542 45-6 44-5 September . 49,083 48,496 40-8 39-6 April . 54,895 55,081 45-6 44-9 October. 50,997 51,210 42-4 41-8 May . 52,405 52,109 43-5 42-5 November . 50,846 50,868 42-3 41-5 June . 49,251 49,675 40-9 40-5 December . 53,019 52,221 44-1 42-6](https://iiif.wellcomecollection.org/image/b31631204_0012.jp2/full/800%2C/0/default.jpg)