Licence: Public Domain Mark
Credit: A treatise on relapsing or famine fever / by R.T. Lyons. Source: Wellcome Collection.
Provider: This material has been provided by the Royal College of Physicians of Edinburgh. The original may be consulted at the Royal College of Physicians of Edinburgh.
195/408 (page 179)
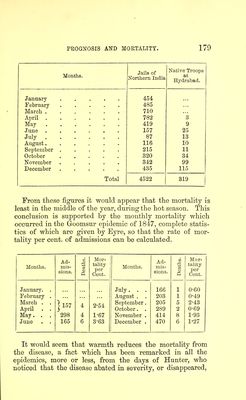
![Months. Jails of NorttLern India x^B-tivo iroops at Hydrabad. January ..... 454 February ..... 485 March ...... 710 April ...... 782 3 May Q June ...... 157 25 July 87 13 August 116 10 September 215 11 October 320 34 November ..... 342 99 December 435 115 Total 4522 319 From these figures it would appear that the mortality is least in the middle of the year, during the hot season. This conclusion is supported by the monthly mortality which occurred in the Goomsur epidemic of 1847, complete statis- tics of which are given by Eyre, so that the rate of mor- tality per cent, of admissions can be calculated. Months. Ad- mis- Mor- tahty Months. Ad- mis- □a Mor- tality sions. CD P per Cent. sions. o P per Cent. January. . July. . . 166 1 0-60 February . August . . 203 1 0-49 March . . ] 157 4 2-54 September. 205 5 2-43 April . . October. . 289 2 0-69 May. . . 298 4 1-67 November . 414 8 1-93 June . . 165 6 3-63 December . 470 6 1-27 It would seem that warmth reduces the mortality from the disease, a fact which has been remarked in all the epidemics, more or less, from the days of Hunter, who noticed that the disease abated in severity, or disappeared,](https://iiif.wellcomecollection.org/image/b21987403_0195.jp2/full/800%2C/0/default.jpg)