Main drainage and sewage disposal works proposed for New York City : reports of experts and data relating to the harbor / Report of the Metropolitan sewerage commission of New York ... April 30, 1914.
- New York (N.Y.). Metropolitan Sewerage Commission
- Date:
- [1914]
Licence: Public Domain Mark
Credit: Main drainage and sewage disposal works proposed for New York City : reports of experts and data relating to the harbor / Report of the Metropolitan sewerage commission of New York ... April 30, 1914. Source: Wellcome Collection.
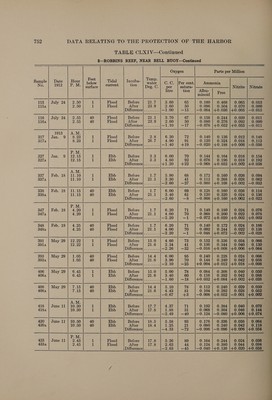
787/806 (page 747)
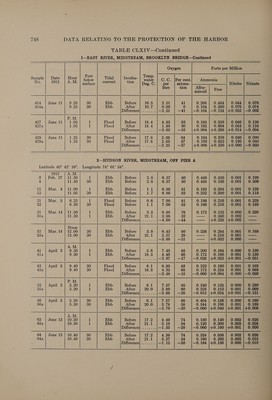
![TABLE CLXIV—Continued — 1—EAST RIVER, MIDSTREAM, BROOKLYN BRIDGE—Continued Oxygen Parts per Million Sample} Date | Hour Feet Tidal Incuba- | Temp: No 1912 P.M below Butvent - sty water C. C. {Per cent. Ammonia , ** | surface Deg. C. per satura- |____________| Nitrite | Nitrate litre tion Albu- F minoid Sot 99 | July 11] 3.30 1 Flood Before 23.9 2.60 50 0.272 | 0.452 | 0.003 | 0.087 994 3.30 1 Flood After 24.4 0.80 15 0.212 0.560 0.056 0.000 Difference}]........ —1.80 —35 —0.060 |+0.108 |+0.053 |—0.087 100 July 11 3.35 30 Flood Before 23.9 2.60 50 0.212 0.456 0.0038 0.057 100a O.30 30 Flood After 24.4 0.80 15 O2180\ | 30.4382 1 0.153)1 ¢ 0.037 Difference]........ —1.80 —35 —0.0382 |—0.024 |+0.150 |—0.020 A.M. 101 | July 24] 9.30 1 Ebb Before 7A aif 2.50 46 0.328 | 0.548 | 0.070 | 0.060 101A 9.30 1 Ebb After 23.9 0.60 11 0.160 | 0.608 | 0.072 | 0.088 Difference]........ —1.90 —35 —0.168 |+0.060 |+0.002 |—0.022 102 | July 24] 9.35 30 Ebb Before Le 2.50 46 0.200 | 0.520} 0.066 | 0.044 1024 9.35 30 Ebb After 23.9 0.70 13 0.116 0.536 0.072 0.028 Difference]........ —1.80 —33 —0.084 |+0.016 |+0.006 |—0.016 P.M. 119 | July 24] 3.40 1 Flood Before 21.7 2.80 50 0.160 | 0.456 | 0.080} 0.000 119A 3.40 1 Flood After 23.9 1.00 19 0.108 | 0.540} 0.112 | 0.000 Difference]........ —1.80 —3l —0.052 |+0.084 |+0.032 | 0.000 120 July 24 3.45 30 Flood Before 21.1 2.80 ill 0.200 0.460 0.078 0.032 1204 3745 30 Flood After 23.9 1.20 23 0.092 | 0.492 | 0.120 | 0.000 Difference]........ —1.60 —28 —0.108 |+0.032 |+0.042 |—0.032 1913 A.M. slo o| Jan. 9: | 7.45 1 Flood Before 2.8 6.00 68 0.204 | 0.168} 0.016} 0.144 313A 7.45 1 Flood After 26.7 4.60 71 0.156 | 0.260 | 0.020 | 0.110 Difference]........ —1.40 +3 —0.048 |+0.092 |+0.004 |—0.034 323 | Jan. 9 | 11.20 1 Ebb Before 3.3 5.60 65 0.144 | 0.156] 0.020 | 0.140 323A 11.20 1 Ebb After 26.7 4.80 86 0.096 | 0.164] 0.016 | 0.144 Difference]........ —0.80 +21 —0.048 |+0.008 }—0.004 |+0.004 333 | Feb. 18 | 10.00 1 Ebb Before 1e7 5.40 62 0.304 | 0.312} 0.036 | 0.114 333A 10.00 1 Ebb After i ear 2.00 38 0.192 | 0.440 | 0.042 | 0.048 Difference]........ —3.40 —24 —0.112 |+0.128 |+0.006 |—0.066 334 | Feb. 18 | 10.05 30 Ebb Before BSS 5.40 62 0.200 | 0.208 | 0.030} 0.140 334A 10.05 30 Ebb After LiF 3.00 De 0.168 | 0.3820] 0.084 | 0.126 Difference]........ —2.40 —5 —0.032 |/+0.112 |+0.004 |—0.014 Pe. 351 | Feb. 18 | 5.10 1 Flood Before | af 5.60 64 0.204 | 0.192} 0.024} 0.166 351A 5.10 1 Flood After 21.1 3.10 55 0.092 | 0.244 | 0.024} 0.166 Difference}........ —2.50 —9 —0.112 |+0.052 | 0.000} 0.000 352 | Feb. 18; 5.15 30 Flood Before 1.7 5.70 65 0.160 | 0.204 | 0.024 | 0.286 352A 5.15 30 Flood After 21.1 3.40 60 0.148 | 0.296 | 0.026) 0.214 Difference]........ —2.30 —5 —0.012 |+0.092 |+0.002 |—0.072 397 | May 29] 3.05 1 Flood Before 15.3 4.70 72 0.108 | 0.252 | 0.034 | 0.056 3974 3:05 1 Flood After 21.6 3.39 59 0.116 | 0.3852 | 0.042 | 0.088. Difference]........ —1.31° | —13 +0.008 |+0.100 |4+0.008 |+0.032 - 399 | May 29} 3.30 30 Flood Before 15.0 2.90 45 0.120 | 0.272 | 0.029} 0.021 399A 3.30 30 Flood After 21.6 2.31 40 0.120 | 0.892 | 0.040 | 0.040 Difference]........ —0.59 —5 —0.000 |+0.120 }+0.011 |+0.019 A.M. 412 | June ll} 9.05. 1 Ebb Before 16.5 2.49 40 0.256 | 0.460 | 0.044 | 0.096 412A 9.05 1 Ebb After 16:7 0.00 0 0.096 | 0.384] 0.050 | 0.060 Difference|........ 2.49 | —40 |—0.160 |—0.076 |+0.006 |—0.036](https://iiif.wellcomecollection.org/image/b32174433_0787.jp2/full/800%2C/0/default.jpg)