Main drainage and sewage disposal works proposed for New York City : reports of experts and data relating to the harbor / Report of the Metropolitan sewerage commission of New York ... April 30, 1914.
- New York (N.Y.). Metropolitan Sewerage Commission
- Date:
- [1914]
Licence: Public Domain Mark
Credit: Main drainage and sewage disposal works proposed for New York City : reports of experts and data relating to the harbor / Report of the Metropolitan sewerage commission of New York ... April 30, 1914. Source: Wellcome Collection.
795/806 (page 755)
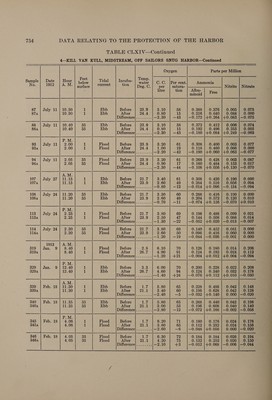
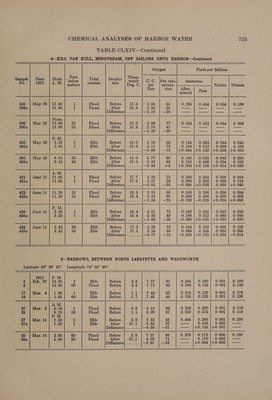
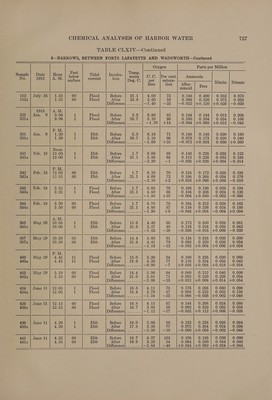
![TABLE CLXIV—Continued 4—KILL VAN KULL, MIDSTREAM, OFF SAILORS SNUG HARBOR—Continued Oxygen Parts per Million Date | Hour | eet Tidal | Incuba- | Ze™P- 1913 A.M below Paccant an water C.C. |Per cent. Ammonia °* | surface Deg. C. per satura- Nitrite | Nitrate litre tion Albu- F minoid Tes May 29 |} 11.40 , Flood Before 15.6 3.90 61 0.296 | 0.484} 0.064] 0.106 1 Flood After 21.6 1.80 31 —— —— —— ee Difference]........ —2.10 —30 — —_——— — _— May 29 | 12.00 35 Flood Before 15.0 4.90 Wa 0.244 | 0.432 | 0.044] 0.066 35 Flood After 21.6 2.70 47 — — — —— Difference]........ —2.20 —30 a —_—— — — 1 Ebb Before 15.0 5.10 86 0.144 | 0.3864] 0.044] 0.046 1 Ebb After 21.6 4.11 Te 0.188 } 0.512} 0.060} 0.100 Difference]........ —0.99 —13 +0.044 |+0.148 |+0.016 |+0.054 35 Ebb Before 15.0 5.70 90 0.148 | 0.340] 0.040] 0.050 35 Ebb After 21.6 5.26 93 0.152 | 0.496 |] 0.054} 0.106 Difference}........ —0.44 +3 +0.004 |+0.156 |+0.014 |+0.056 1 Flood Before Vea 4.39 73 0.160 | 0.324 | 0.036} 0.084 1 Flood After 17.8 2eot 39 0.092 | 0.360 | 0.0386} 0.124 Difference]........ —2.02 —34 —0.068 |+0.036 | 0.000 |+0.040 423 June 11 | 11.20 35 Flood Before 18.5 3.92 66 0.180 0.296 0.036 0.084 4234 1.20 35 Flood After 18.4 Deon 38 0.080 | 0.268 | 0.070] 0.090 Difference]........ —1.59 —28 —0.100 |—0.028 |+0.034 |+0.006 P. M. 436 | June 11 3.30 1 Ebb Before 18.4 4.61 78 0.160 | 0.324} 0.040] 0.090 436A 3.30 1 Ebb After 18.4 2.92 49 0.100 | 0.352 | 0.060] 0.090 Difference]........ —1.69 —29 —0.060 |+0.028 |+0.020 | 0.000 438 | June 11 3.45 30 Ebb Before 1752 4.33 72 0.104 |} 0.228] 0.028 | 0.102 4384 45 30 Ebb After 17.1 3.56 59 0.096 | 0.356] 0.062 | 0.088 Difference|........ —0.77 —13 —0.008 }+0.128 |+0.034 |}—0.014 5—NARROWS, BETWEEN FORTS LAFAYETTE AND WADSWORTH Latitude 40° 36’ 25”. Longitude 74° 02’ 48”. 1912 P.M. 5 | Feb. 27 | 12.30 1 Ebb Before 2.8 7.57 92 0.364 | 0.290} 0.001 0.190 6 12.40 60 Flood Before 3.3 7.71 98 0.346 | 0.1384] 0.001 0.149 17 | Mar. 4 1.00 1 Ebb Before 3 7.43 88 0.219 | 0.223; 0.001 0.179 18 1.05 60 Ebb Before Litt 7.48 88 0.216 | 0.223 | 0.001 | 0.129 A.M. 27 | Mar. 5] 8.10 1 Flood Before 0.6 8.15 96 0.230 | 0.300} 0.001 0.119 28 8.15 60 Flood Before 1.1 8.00 97 0.250} 0.272] 0.001} 0.119 P.M. 37 | Mar. 14] 1.50 1 Ebb Before 3.9 7.43 88 0.404 | 0.268 | 0.001 | 0.239 374 1.50 1 Ebb After 21.1 3.43 57 —— 0.416 | 0.002} —— Difference]........ —4.00 —31 — |+0.148 |+0.001 —— 38 | Mar. 14] 2.00 60 Flood Before 3.9 (aod 95 0.276 | 0.172] 0.000 {| 0.100 38a 2.00. 60 Flood After 21.1 4.00 71 waa 0.176 | 0.002 | —— Difference]........ —3.57 —24 —— |+0.004 }/+0.002 a](https://iiif.wellcomecollection.org/image/b32174433_0795.jp2/full/800%2C/0/default.jpg)