Main drainage and sewage disposal works proposed for New York City : reports of experts and data relating to the harbor / Report of the Metropolitan sewerage commission of New York ... April 30, 1914.
- New York (N.Y.). Metropolitan Sewerage Commission
- Date:
- [1914]
Licence: Public Domain Mark
Credit: Main drainage and sewage disposal works proposed for New York City : reports of experts and data relating to the harbor / Report of the Metropolitan sewerage commission of New York ... April 30, 1914. Source: Wellcome Collection.
796/806 (page 756)
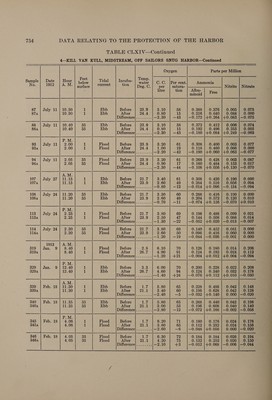
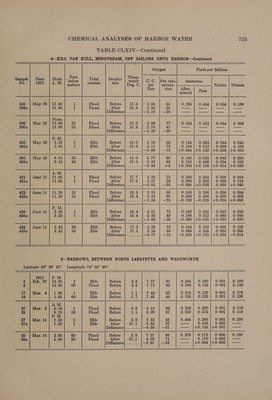
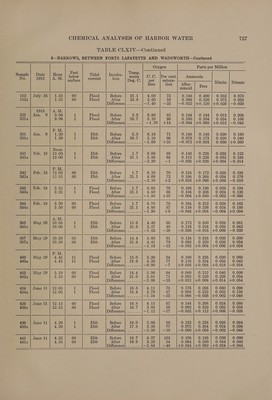
![TABLE CLXIV—Continued 5—NARROWS, BETWEEN FORTS LAFAYETTE AND WADSWORTH—Continued Oxygen Parts per Million Hour Feet Tidal Incuba- Temp. C.C. |Per cent. Ammonia A.M below current tion water er satura 4 pu. follie e aeneonye eee 7* | surface Deg. C. te 4 ion Albu- Hyad Nitrite minoid 11.00 1 Flood Before 6.1 Cat 97 0.204 | 0.156 | 0.001 11.00 1 Flood After 18.3 4.86 78 0.136 | 0.164 | 0.001 Difference]........ —2.85 —19 —0.068 |+0.008 | 0.000 11.10 60 Flood Before 6.1 7.50 98 0.200 | 0.156] 0.001 11.10 60 Flood After 18.3 4.87 81 0.160 | 0.148 | 0.001 Difference]........ —2.70 —17 —0.040 |—0.008 | 0.000 P.M. 3.50 1 Ebb Before 6.1 7.43 88 0.192 | 0.216 | 0.000 3.50 1 Ebb After 18.3 4.17 63 0.108'} 0.192°] -O200E Difference}........ —3.26 —25 —0.084 |—0.024 |+0.001 4.00 60 Ebb Before 6.1 7.14 87 0.208 | 0.164 | 0.001 4.00 60 Ebb After 18.3 4.06 64 0.104 | 0.184 | 0.001 Difference]........ —3.08 —23 +0.104 |+0.020 0.000 A.M. 1055 1 Ebb Before 17.2 4.29 71 0.192 | 0.080 | 0.002 19055 1 Ebb After 21 3.47 62 0.152 | 0.284 | 0.002 Difference]........ —0.82 —9 —0.040 |+0.204 0.000 Noon 70 | June 13 | 12.00 60 Ebb Before 16.7 4.39 73 0.236 | 0.076 | 0.002 70A 12.00 60 Ebb After pa ed | 3457 64 0.128 |} 0.280} 0.003 Difference]........ —0.82 —9 |—0.108 |+0.204 |+0.001 P.M. ; 71 June 13 2.30 1 Flood Before 17.2 4.80 80 0.208 0.136 0.002 71a 2.30 1 Flood After 21.4 3.58 68 0.136 | 0.332 | 0.003 Difference]........ —1.22 —12 —0.072 }+-0.196 |+0.001 72 | June 13 | 2.325 60 Flood Before 16.7 4.90 81 0.296 | 0.100} 0.002 72A 2280 60 Flood After PANEL 3.68 66 0.128 |} 0.224} 0.004 Difference}........ —1.22 —15 —0.168 }+0.124 }+0.002 A.M. 89 | July 11 | 11.15 1 Ebb Before 23.9 3.20 61 0.284 | 0.3840 | 0.003 89a Tad ts a Ebb After 24.4 1.00 19 0.132 0.412 0.094 Difference]........ —2.20 —42 —0.152 |+0.072 |+0.091 90 | July 11 | 11.25 60 Ebb Before 23.6 BEoU 63 0.228 | 0.356 | 0.008 90a hi tad: 60 Ebb After 24.4 1.00 19 0.120 | 0.400 | 0.085 Difference]........ —2.30 —44 —0.108 |+0.044 |+0.032 P.M. 91 | July 11 1.30 1 Flood Before 23.9 3.90 75 0.348 | 0.232 | 0.0038 Q1a 1.30 1 Flood After 24.4 1.80 35 0.148 | 0.486 | 0.064 Difference}........ —2.10 —40 —0.200 |+0.204 |+0.061 92 | July 11 1.35 60 Flood Before 23.6 4.00 77 0.236 | 0.308 | 0.003 92a 1.35 60 Flood After 24.4 1.80 35 0.124 | 0.380] 0.051 Difference]........ —2.20 —42 —0.112 |+0.072 |+0.048 A.M. 109 | July 24 | 11.45 1 Ebb Before WAT 3.40 62 0.160 | 0.452 | 0.054 109a 11.45 1 Ebb After 23.9 2.20 42 0.152 | 0.500 | 0.066 Difference]........ —1.20 | —20 |—0.008 |+0.048 |+0.012 110 | July 24 | 11.50 60 Ebb Before ys ia 3.40 62 0.188 | 0.388 | 0.070 110a 11.50 60 Ebb After 23.9 2.40 46 0.120 | 0.496 | 0.020 Difference]........ —1.00 —16 —0.068 |+0.108 |—0.050 P.M. | 111. oh uby 2437) 250 1 Flood Before 21.7 3.90 Th 0.244 | 0.456] 0.056 111la 1.50 1 Flood After 23.9 2.40 46 0.096 0.420 0.050 Difference]........ —1.50 —25 —0.148 |—0.086 |—0.006 Nitrate 0.139 0.069 —0.070 0.109 0.069 —0.040 0.150 0.149 —0.001 0.239 0.129 0.110 0.029 0.019 —0.010 0.038 0.037 —0.001 0.048 0.047 0.028 0.006 0.077 0.000 0.047 0.000 —0.047 0.047 0.006 —0.041 0.087 0.000 —0.087 0.026 0.034 0.000 0.120 +0.120 0.064 0.020 —0.044 Se Se](https://iiif.wellcomecollection.org/image/b32174433_0796.jp2/full/800%2C/0/default.jpg)