Volume 1
A cycle of eighteen years in the seasons of Britain; deduced from meteorological observations made at Ackworth, in the West Riding of Yorkshire, from 1824 to 1841; compared with others before made for a like period (ending with 1823) in the vicinity of London / By Luke Howard ... With five plates.
- Luke Howard
- Date:
- 1842
Licence: Public Domain Mark
Credit: A cycle of eighteen years in the seasons of Britain; deduced from meteorological observations made at Ackworth, in the West Riding of Yorkshire, from 1824 to 1841; compared with others before made for a like period (ending with 1823) in the vicinity of London / By Luke Howard ... With five plates. Source: Wellcome Collection.
18/44 page 12
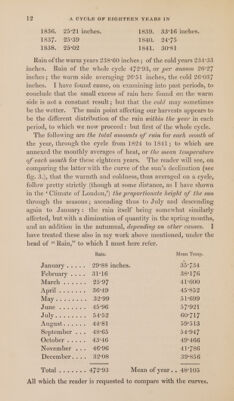
![1836. 25°21 inches. 1839. 33°16 inches. 1837. 25°39 1840. 24°75 1838. 25°02 1841. 30°81 Rain of the warm years 238°60 inches; of the cold years 234°33 inches. Rain of the whole cycle 472°93, or per annum 26°27 inches; the warm side averaging 26°51 inches, the cold 26°037 inches. I have found cause, on examining into past periods, to conclude that the small excess of rain here found on the warm side is not a constant result; but that the cold may sometimes be the wetter. ‘The main point affecting our harvests appears to be the different distribution of the rain within the year in each period, to which we now proceed: but first of the whole cycle. The following are the total amounts of rain for each month of the year, through the cycle from 1824 to 1841; to which are annexed the monthly averages of heat, or the mean temperature of each month for these eighteen years. The reader will see, on comparing the latter with the curve of the sun’s declination (see fig. 3.), that the warmth and coldness, thus averaged on a cycle, follow pretty strictly (though at some distance, as I have shown in the ‘ Climate of London,’) the proportionate height of the sun through the seasons; ascending thus to July and descending again to January: the rain itself being somewhat similarly affected, but with a diminution of quantity in the spring months, and an addition in the autumnal, depending on other causes. I have treated these also in my work above mentioned, under the head of “ Rain,” to which I must here refer. Rain. Mean Temp. JAMUAT YS 6 29°88 inches. 35°734 February .... 31°16 38°176 Miareh. 6% 66 25°97 41°600 Oi tone eat pgee 36°49 45°852 IME Ss oes ae 99 51°699 June oss Si: 45°96 57°921 July alae. ude 60°717 AUSUStis cious 44°81] 59°513 September ... 48°65 54:°947 October ..... 43°46 49°466 November ... 46°96 41°786 December.... 32°08 39°856 Totals. act sne 47 2°93 Mean of year. . 48°105 All which the reader is requested to compare with the curves.](https://iiif.wellcomecollection.org/image/b29305196_0001_0018.jp2/full/800%2C/0/default.jpg)
 No text description is available for this image
 No text description is available for this image
 No text description is available for this image