Report of the Royal Commission on the Poor Laws and Relief of Distress. : Appendix Volume XII. Memoranda by individual commissioners on various subjects.
- Royal Commission on the Poor Laws and Relief of Distress 1905-09
- Date:
- 1910
Licence: In copyright
Credit: Report of the Royal Commission on the Poor Laws and Relief of Distress. : Appendix Volume XII. Memoranda by individual commissioners on various subjects. Source: Wellcome Collection.
Provider: This material has been provided by London School of Hygiene & Tropical Medicine Library & Archives Service. The original may be consulted at London School of Hygiene & Tropical Medicine Library & Archives Service.
413/492 page 395
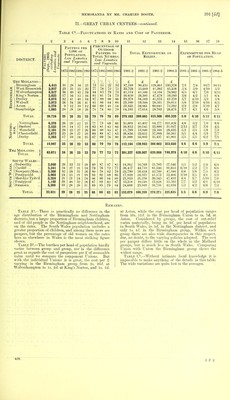
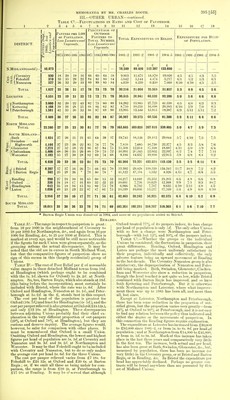
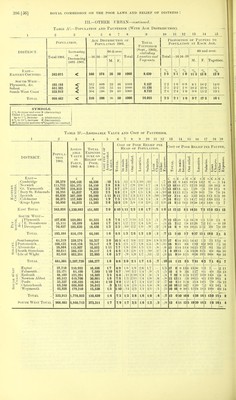
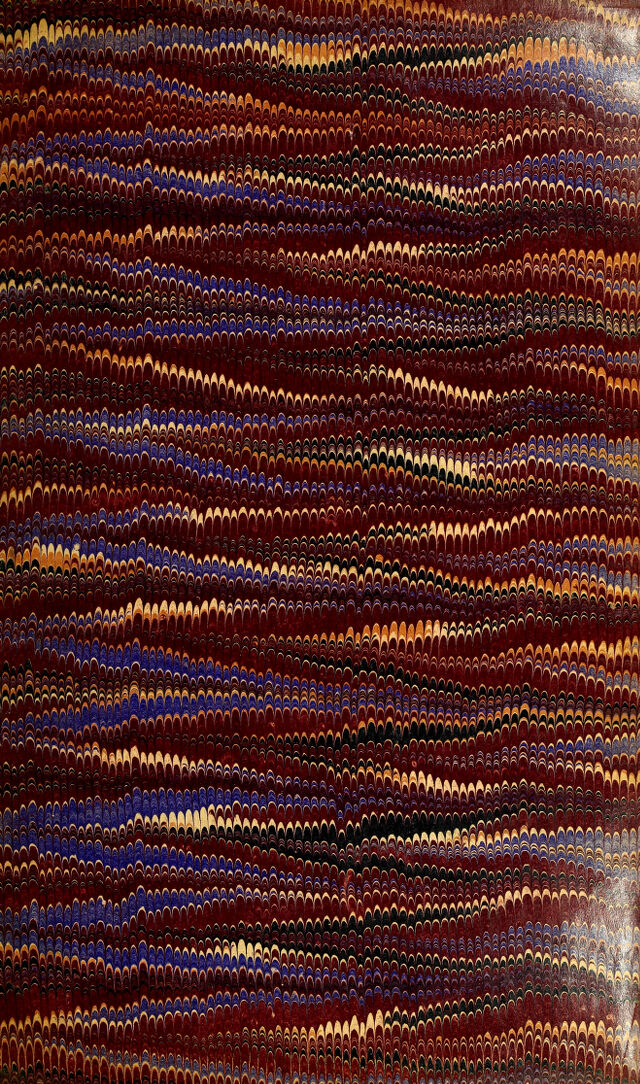
![III.—OTHER URBAN—continued. Table C2.—Fluctuations in Ratio and Cost of Pauperism. 1 o 3 4 5 6 7 8 9 10 11 11 12 13 14 15 16 17 18 iLl Paupers pbr l,00t Percentage of Outdoor Paupers to Total Number, Less Lunatics and Vagrants. DISTRICT. A.UPERS (Se] 1903), lest Lunatics a Vagrants. of Population, Less Lunatics and Vac/rants. Total Expenditure on Relief. expenditure per head of Population. 1875 1885 1 189; 1905 187i 188c 1 1881-2 1891-2 1901-2 1904-5 1881-2 1891-2 1901-2 1904-5 1 .ill iWxj A IN Lf\L(Jil vU,t) 10,473 £ 76 249 £ 69,456 £ 112387 £ 133,890 h £\ FoleshiU ^ h [Nuneaton 930 370 527 18 33 36 20 35 32 19 28 20 16 22 19 66 84 89 60 81 89 64 80 85 1 58 ! 84 | 84 9 913 5,642 4,659 11,671 5,144 4,239 14,870 4.474 6,220 19,020 5,217 7,660 4/5 6/1 6/10 4/5 5/2 4/10 4/3 5/3 4/5 5/5 6/1 5/5 Total 1,827 25 26 21 17 78 73 73 70 20,214 21,054 25,564 31,897 5/3 4/8 4/5 5/6 T .E,Tr,trQrrPT? jjHiivriO i i. iv ... ... 4,531 22 19 21 32 72 72 71 7ft 30,415 38,941 68,528 92,398 5/0 5/6 6/6 8/8 '— i Northampton ... W (Peterborough ... 2,660 1,168 1,581 32 39 42 20 36 33 22 28 30 43 25 32 82 88 88 75 86 87 oo 82 89 88 82 90 14,262 8,710 13^995 15,865 10,259 13,444' 27,723 16,898 15,915 41,530 20,383 19,387 4/5 6/10 6/9 4/0 5/9 5/11 6/3 7/0 5/11 9/3 8/5 7/2 Total 5,409 36 27 26 35 86 82 84 87 Oft OCT 39,573 60,536 81,300 5/8 4/11 6/4 8/6 North Midland Total 22,240 27 23 23 30 81 77 76 79 163,845 169,024 267 015 339,485 5/0 4/7 5/9 7/3 Rhttth Mini ,\wt» /Bath 1,421 27 26 21 21 65 64 p. 7 19,741 18,126 28,183 29,044 .5/7 4/10 7/3 7/5 1 ^ wi n f\ on *i n M o3 J Highworth 5S Gloucester tjT (]l &] t £»T1 V* ft 1Y1 1 1 LC 1 I C 11 lldili ——! ^Worcester 1,144 1,275 1,406 1,182 37 27 48- oo 23 32 36 -/ 20 28 31 •so 22 22 26 Z5 85 86 88 76 87 79- py 77 84 75 74 78 75 72 68 7,858 11,508 16,991 9 J 86 7,685 12,614 2( ',165 16,730 17,108 22,052 iy,o Jo 22,377 18,687 22,997 4/5 4/11 6/2 0/8 8/3 5/0 7/4 O/O 5/8 5/9 7/7 Q IA 5/4 7/6 6/4 7/11 two 9/2 Total 6,428 35 29 26 23 81 i «j 73 70 65,284 73,227 103,971 115,120 5/5 5/5 6/11 7/8 I/O E2 i t Hristnl g g ( Barton Regis 8,287 342 57 25 57 28 56 26 26 71 79 66 80 65 78 70 33,392 41^122 29,828 43,094 118,539 5,332 134,342 4,326 11/7 4/11 10/8 4/7 7/2 . 6/8 8/2 .5/5. . / Reading £ J Oxford ... J j Headington - [Luton 990 326 612 1,026 27 34 35 49 24 18 18 33 10 17 16 23 16 16 13 22 65 60 85 87 60 32 80 87 15 22 75 81 53 23, 78 75 14,217 10,681 6,966 10,599 14,048 7,730 6,792 10,60(1 23,332 10,629 7,707 15,257 24,203 12,168 8,635 17,569 6/6 9/9 4/10 5/4 4/8 7/1 , 3/11 4/9 6/6 9/3 4/0 6/0 6/8 10/7 4/5 6/10 Total 2,954 37 24 16 17 77 71 56 61 42,463 39,242 56,925 62,575 6/4 4/10 6/2 6/9 South Midland Total 18,011 35 | 30 26 23 78 74 71 69 182,261 186,291 284,767 316,363 6/1 5/6 7/10 7/7 * Barton Regis Union was dissolved in 1904, and most of its population added to Bii>tol. Remarks. Oxford treated 77% of its paupers indoor, its loan charge Table A2.—The range in respect to pauperism is great: from 16 per 1000 in the neighbourhood of Co\ entry to 28 per 1000 for Northampton, &c, and again from 16 per 1000 for Reading, &c, to 25 per 1000 at Bristol. This is marked at every age, and would be still more noticeable if the figures for each Union were given separately, as the grouping softens the actual discrepancies. It may be noted that the old are in excess in South Midland West, but that the comparative figures of pauperism show no sign of this excess in this (largely residential) group of Unions. Table B2.—The cost of Poor Relief per £ of assessable value ranges in these detached Midland towns from lOd. at Headington (which perhaps ought to be combined with the Is. Id. shown for Oxford) to 2s. 2d. at North- ampton. So, too, Barton Regis, which also stands at 10d. (this being before the incorporation), must certainly be included with Bristol, where the rate was Is. 8d. After Oxford and Headington, Nuneaton at Is. Id., and Peter- borough at Is. 2d. in the £, stands best in this respect. The cost per head of the population is greatest for Oxford (10s. Id.) and least for Headington (4s 5d.\and the cost per pauper relieved is also greatest atOxford(£24.12s.), and only £13 18s. at Headington. These discrepancies between adjoining Unions probably find their chief ex- planation in the very different proportion of out-paupers (23% at Oxford and 78% at Headington), but they are curious and deserve inquiry. The average figures would, however, be safer for comparison with other places. It must be remembeied that Oxford is a small Union. Omitting Oxford and Headington, the lowest and highest figures per head of population are 5s. 5d. at Coventry and Nuneaton and 9s. 3c?. and 9s. 2d. at Northampton and Worcester. It may be that FoleshiU ought to be included with Coventry and Nuneaton, but to do so only makes the average cost per head 5s. 6d. for the three Unions. The cost per pauper relieved varies from £7 18s. for FoleshiU to £24 12s. at Oxford and £20 6s. at Barton Regis; or, if we omit all these as being unfair for com- parison, the range is from £10 2s. at Peterborough to £17 18s. at Reading. It may be o1 served that although per head of population is only Id. The only other Unions with so low a charge were Northampton and Peter- borough—with but 12% and 10% of the paupers indoor. Table C2.—Whether the groups or the individual Unions be considered, the fluctuations in pauperism show great differences. Reading, Oxford, Headington and Luton are perhaps the most uniformly satisfactory in their progress, individually and collectively, the only adverse feature being an upward movement at Reading in the last decade. The Coventry-Nuneaton group is also satisfactory, the depauperisation of Nuneaton and Foles- hiU being marked. Bath, Swindon, Gloucester, Chelten- ham and Worcester also show a reduction in pauperism, though the level reached is not quite so low, while Bristol combined with Barton Regis has improved, and so have both Kettering and Peterborough. But it is otherwise with Northampton and Leicester, where what improve- ment there was up to 1885 has been all, and more than all, lost since. Except at Leicester, Northampton and Peterborough, there has been some reduction in the proportion of out- relief given, but the proportion varies very greatly—from 23% at Oxford to 90% at Peterborough, and it is not easy to find any relation between the policy thus indicated and either the degree or the movements of pauperism. In this connection the Reading figures require explanation. The expenditure at Leicester has increased from £30,000 to £92,000 since 1881-2, or from 5s. to 8s. 8d. per headjjt population ; and at Northampton from £14,000 to £41,000,. or from 4s. bd. to 9s. 3d. Much of this increase has taken place in the last three years and comparatively very little in the first ten. The increase, both actual and per head, has also been great at Bath, Swindon, Gloucester, &c, but> measured by population, there has been no increase (or very little) in the Coventry group, or at Bristol and Barton Regis, or in Reading, &c. In Bristol the expenditure per head has appreciably declined. Perhaps no greater con- trasts will be found anywhere than are presented by this set of Midland Unions.](https://iiif.wellcomecollection.org/image/b24399735_0421.jp2/full/800%2C/0/default.jpg)