Report of the Royal Commission on the Poor Laws and Relief of Distress. : Appendix Volume XII. Memoranda by individual commissioners on various subjects.
- Royal Commission on the Poor Laws and Relief of Distress 1905-09
- Date:
- 1910
Licence: In copyright
Credit: Report of the Royal Commission on the Poor Laws and Relief of Distress. : Appendix Volume XII. Memoranda by individual commissioners on various subjects. Source: Wellcome Collection.
Provider: This material has been provided by London School of Hygiene & Tropical Medicine Library & Archives Service. The original may be consulted at London School of Hygiene & Tropical Medicine Library & Archives Service.
419/492 page 401
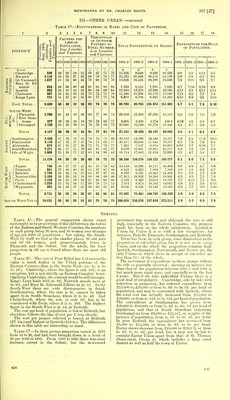
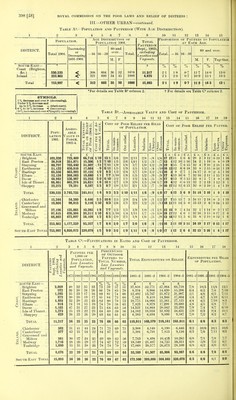
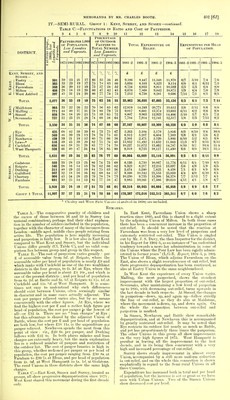
![IV.—SEMI-RURAL. Group 1: Kent, Surrey, and SussEX—continued. Table C—Fluctuations in Ratio and Cost of Pauperism. 1 2 3 4 5 6 7 8 9 10 11 12 13 14 15 16 17 18 Percentage Paupers per 1,000 of Outdoor OF Population. Paupers to Total Expenditure on Expenditure per Head Less Lunatics Total Number. Relief. of Population. DISTRICT. — CO pi or d Vagrants. Less Lunatics y§« t and Vagrants. < H 1 87^ 1885 1895 1905 1875 1885 1895 1905 1881 9 loo1—A 18Q1 9 ioyi—& i om o iyui—& 1 GfLi ^ IV\J'±—Q 1881-21891-2 1 OA 1 C Kent, Surrey, and 7= 7. 7„ 7o £ £ £ £ Sussex—■ l Eastry ... 501 39 oo ao 01 ill 1 7 17 OO 55 56 46 9,186 8,447 11,548 11,870 6/7 5/10 7/4 7/6 £5 Blean 365 oo oo 23 19 17 75 7. t 70 CO Do 66 5,634 fi 100 9,114 6/0 6/1 fi/i l U| 11 7/1; M Faversham 348 oo OA 12 73 57 24 52 6 754 OyVOO o,ol 1 1 V,UOO 5/5 5/5 fi/8 8/0 M ' Milton 466 29 18 19 20 80 A 1 47 A O 412 45 6 676 / ,OUo 10 871 5/9 6/4 7 /rt 7/Q //y West Ashford ... 397 31 24 20 86 77 74 73 7,212 V ,0*/U 7/11 7/1 8/1 8/1 Q/t a jo Total 2,077 36 23 19 19 75 62 54 55 36,095 47,005 •59 131 6/3 6/1 7/2 7/11 'Maidstone 964 33 22 26 22 70 56 65 62 12,819 14,249 20,771 19,612 5/8 5/11 8/6 8/0 n Mailing 771 44 40 37 31 78 80 79 75 9,017 8,681 13,374 13,693 6/11 6/2 9/6 9/8 Strood 858 ow .18 20 25 75 09 65 *70 72 8,007 Q Qfi0. <7,yoo 1 Q QQ1 1 LyOLiO 14,406 5/10 5/7 u/o 7/9 ^Sevenoaks 737 22 oo O 1 *JI oo 74 68 58 64 7 704. 19 141 19 ^17 5/8 5/3 7/1 1 8/9 1UIAL 3,330 OR <3£> oc oc ZO 74 67 68 68 fid 99S 6/0 5/9 8/0 R/1 0/1 ' Rye 425 08 42 39 39 81 73 75 67 5 263 5,104 5,179 81fi 8/9 8/10 9/4 10/6 Battle 349 46 39 23 13 78 78 75 61 6^912 5,207 6,604 7,389 9/6 6/1 5/6 6/2 w Newhaven ... ~ 128 39 21 19 12 80 71 66 38 2,501 2,471 5,120 5,886 6/10 5/2 8/5 9/8 Lewe<* ... 516 49 43 39 29 82 75 76 60 13,832 11,492 11,632 11,663 11/5 9/7 9/11 9/11 ij Cuckfield 656 44 38 31 29 83 77 74 70 10,237 11,672 13,462 14,787 8/10 9/7 10/4 11/4 i. West Hampnett 558 46 40 47 34 84 76 85 88 9,319 9,723 10,117 11,450 9/6 9/0 10/1 11/5 Total 2,632 49 39 34 25 82 76 77 69 48,064 45,669 52,114 56,991 9/5 8/5 8/11 9/9 'Godstone 559 33 28 23 23 86 74 75 68 6,136 5,750 10,867 11,776 6/11 6/1 7/10 8/5 Reigate 546 28 16 14 15 76 62 66 62 8,323 8,217 12,255 13,697 5/6 4/6 5/9 6/5 w Dorking 311 40 29 22 19 84 75 63 56 5,474 5,240 7,625 8,438 7/1 6/1 8/9 9/8 tf ( « 1 Guildford 947 32 18 16 16 82 69 64 57 9,166 10,342 21,153 25,059 4/4 4/0 6/10 7/7 8/1 fcj Chertsey 904 43 34 28 23 79 78 78 73 10,230 9,733 15,398 16,378 7/7 5/11 8/1 , Farnham 691 30 25 14 13 81 77 58 47 9,885 10,161 17,586 20,610 4/11 4/1 5/8 6/7 Total 3,958 33 24 18 17 | 73 68 61 49,214 49,443 84,884 95,958 5/8 4/9 6/8 7/7 Group 1 Total 11,997 37 27 23 21 j 78 70 68 64 170,287 172,014 243,212 265,311 6/7 6/0 7/6 8/2 Clv.iiley and West Firle Uni jiii (d.ssolvod in 1898) are included. Remarks. Table A.—The comparative paucity of children and the excess of those between 16 and 59 in Surrey (au unusual combination), perhaps hud their chief explana- tion in the number of soldiers included in the population, together with the character of many of the incomers from London—middle aged, middle class people retiring from active life. The population is here rapidly increasing and pauperism is fairly low. It is low also in East Kent compared to West Kent and Sussex, but the individual Unions differ greatly (Cf. Table C), and no valid com- parison lies between group and group in this respect. Table B.—The cost of pauperism varies greatly : per £ of assessable value from 9d. at Reigate, where the assessable value per head of population is nearly £9, and which ranks with Cuckfield as one of the two wealthiest districts in the four groups, to 2s. 3d. at Rye, where the assessable value per head is about £4 10s , and which is one of the poorest districts ; and per head of population from 6s. 2d. at Battle and 6s. 6d. at Reigate to 1 Is. 4d.at Cuckfield and lis. *d. at West Hampnett. It is some- times not easy to understand why such differences should exist between Unions, often seemingly similar in character and in some cases actually adjacent. The cost per pauper relieved varies also, but by no means concurrently with the other figures. At Rye, where we find the highest cost per £ and a rather high figure per head of population, the cost per pauper is the lowest of al]—or £12 4s. There are no loan charges at Rye ; but this advantage is shared by the adjacent Union of Battle, where the cost per £ and per head of population are both low, but where £18 lis. is the expenditure per pauper relieved. Newhaven spends the most from this point of view : viz., £29 6s. per pauper, and Dorking follows with £22 4s. In both places salaries and loan charges are extremely heavy, but the main explanation lies in a reduced number of paupers and restriction of the outdoor list. The cost of pauper lunatics is high in this group, whether reckoned per pauper or per head of copulation, the cost per pauper ranging from £30 8s. at farnham to £39 7s. at Blean, and per head of population from 2s. 9d. at West Hampnett to Is. Id. at Godstone. The ruial Unions in these districts show the same high charges. Table C.—East Kent, Sussex and Surrey, treated as groups, all show progressive depauperisition since 1875 ; West Kent shared this movement daring the first decade only. I In East Kent, Favex-sham Union shows a sharp reaction since 1895, and this is shared to a slight extent by the adjoining Union of Milton. In both these cases there has been a concurrent increase in the proportion of out-relief. It should be noted that the reaction at Faversham was from a very low level of pauperism and extremely restricted out-relief. This Union is singled out by Mr. J. S. Davy, the then Inspector for the district, in his Report for 1904-5, as an instance of an undoubted tendency towards a more lax administration in some of the Unions where the Poor Law has been rigidly admin- istered in former years (L.G.B. Report, 1904-5, p. 180). The Union of Blean, which adjoins Faversham on the East, also shows a slight recrudescence of out-relief, but there progressive depauperisation has been continued, as also at Eastry Union in the same neighbourhood. In West Kent the experience of every Union varies.. Mailing, the most pauperised, shows the steadiest improvement with the largest proportion of out-relief. Sevenoaks, after maintaining a low level of pauperism up to 1895, with decreasing out-relief, turns upwards in the last decade in both respects. At Strood, the changes in pauperism—down, up, and again up—follow strictly the line of out-relief, as they do also at Maidstone, where the movement is down, up, and down again. On the whole the connection between out-relief and pauperism is marked. In Sussex, Newhaven and Battle show remarkable depauperisation, and at Newhaven this is accompanied by greatly restricted out-relief. It may be noted that Rye restricts its outdoor list nearly as much as Battle,, and yet has proportionately three times the pauperism. The other Unions in this group all show improvement on the very high figures of 1875. West Hampnett ia peculiar in leaving all the improvement to the last decade, and in its being then concurrent with a very high and increased percentage of out-relief. Surrey shows steady improvement in almost every Union, accompanied by a still more uniform reduction in out-relief, and on the whole this connection is shown emphatically in regard to the Semi rural Unions in all three Counties. Expenditure has increased both in total and per head of population, but the increase is not so great as we have seen with Urban Unions. Two of the Sussex Unions show decreased cost per head.](https://iiif.wellcomecollection.org/image/b24399735_0427.jp2/full/800%2C/0/default.jpg)