Report of the Royal Commission on the Poor Laws and Relief of Distress. : Appendix Volume XII. Memoranda by individual commissioners on various subjects.
- Royal Commission on the Poor Laws and Relief of Distress 1905-09
- Date:
- 1910
Licence: In copyright
Credit: Report of the Royal Commission on the Poor Laws and Relief of Distress. : Appendix Volume XII. Memoranda by individual commissioners on various subjects. Source: Wellcome Collection.
Provider: This material has been provided by London School of Hygiene & Tropical Medicine Library & Archives Service. The original may be consulted at London School of Hygiene & Tropical Medicine Library & Archives Service.
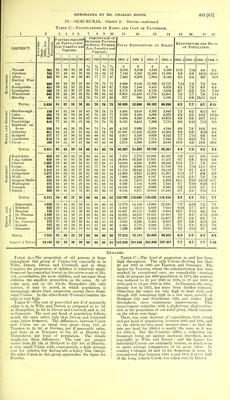
424/492 page 406
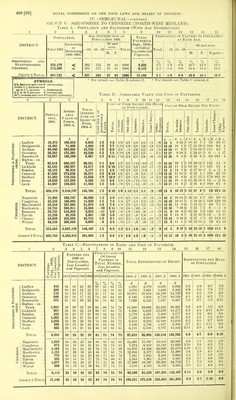
![IV.—SEMI-RURAL-continued. GROUP 4 : SEVERN VALLEY (WEST MIDLAND). Table A.—Population and Pauperism (With Age Distribution). 2 3 4 5 6 7 8 9 10 11 12 13 14 I, Population. Age Distribution of Population 1901. Total Pauperism (Sept., 1903,) excluding Lunatics and V agran fs. Proportion of Paupers to Population at Each Age Total 1901. Increasing or Decreasing 1891-1901. —16 16—59 60 and over Total. Total. —16 16—59 60 and over. M. F. M. F Together. Gloucester & Hereford Worcester & Warwick 150,486 331,032 > < 345 337 548 567 48 42 59 54 1000 1000 t 4,462 7,891 7, 3-0 2 4 7= 2 5 1-7 7o 11 0-8 7c 11-9 124 7, 15-8 159 7c 14 0 14-4 Group 4 Total 481,518 < 340 561 44 55 1000 12,353 2-6 1-9 0-9 12.2 15-8 14-2 SYMBOLS. - % decrease and over > (decreasing) Under 2 % decrease and up to 5 % increase — (stationary), o % to 10 % increase < (increasing). 20% increase and over <*(rapidly increasing). For details see Table B column 2. t For details see Table C, column 2. Table B.—Assessable Value and Cost of Pauperism. 1 2 3 6 10 11 12 13 14 15 16 17 18 19 DISTRICT. Q < B €> ~ O B ps o o < PS> /Cirencester .. Stroud Westbury-on Severn .. Tewkesbury Leominster .. Hereford VDore ... Total /Upton-on - Severn .. Evesham Alcester Droitwich .. Bromsgrove .. Kidderminster Warwick Rugby Pershore Solihull \Atherstone Popula- tion, 1901. 19,620 39,974 22,864 12,709 13,341 34,653 7,325 Total Group 4 Total 150,486 29,316 17,629 20,979 18,374 35,630 40,769 54,906 34,328 12,754 48,618 17,729 331,032 481,518 Assess- able Value in Force, 1903-4. £ 93,062 150,501 94,974 69,398 85,995 217,077 60,477 ►H O £ W I Ph fi o b % ps~ < o o H w O p 2^ H B H B PS w P, m H <! x ^' °l O k to 9,536] 2/1 14,407 1/11 9,038 4,210 4,994 14,304 4,120 771,484 183,779 85,230 78,930 114,387 172,386 164,272 366,877 230,002 81,905 275,495 95,651 61,609 1,876,914 2,648,398 11,138 7,787 9,418 7,512 10,516 17,522 20,636 11,263 5,127 10,709 5,672 117,300 178,909 1/11 1/3 1/2 1/4 1/8 1/7 1/3 1/10 2/6 1/4 1/3 2/2 1/1 -/10 1/3 -/» 1/2 Cost of Poor Relief per Head of Population. 9/9 7/3 7/11 6/8 7/6 8/3 14/0 8/2 7/7 8/10 9/0 8/2 5/11 8/7 7/6 6/7 8/0 4/5 6/5 1/3 7/1 1/4 7/5 2 C S cs it P p o> 2/0 1/8 1/8 1/4 1/2 1/3 2/0 1/7 1/3 1/10 1/7 -/ll 1/0 2/5 1/4 1/0 1/7 -/9 1/0 3/0 2/4 2/11 2/2 2/11 2/10 5/1 2/10 3/1 2/2 3/7 3/8 2/4 2/1 2/2 2/10 2/6 1/1 2/9 2/5 2/6 1/5 1/6 1/7 1/2 1/8 2/0 2/9 1/8 1/2 1/2 1/8 1/9 1/1 1/5 1/4 1/0 1/6 1/0 -/» 1/3 1/5 1/8 1/3 1/1 1/3 1/4 1/5 2/3 1/4 3 y -/2 -n -/2 -/i -n -18 12 1/1 -/6 -/I -13 -n -/s -/3 -/5 -A -I* -/4 » P 1/0 -/5 -/6 -/8 -/5 -/8 1/3 Cost of Poor Belief Per Pauper Relieved. 6 12 12 11 15 10 3 9 1 10 11 12 3 11 19 -n -9 -/ll -/* -/4 -/6 -/10 -/7 -/7 1/0 -15 -/ll 11 710 2 10 14 14 8 11 12 10 14 11 4 11 12 14 8 12 13 10 7 13 1 12 1 2 a T p & 5 10 12 11 15 10 13 6 12 8 17 9 11 10 5 8 17 10 18 11 15 12 4 10 17 11 17 10 6 10 8 11 10 9 10 12 7 12 310 16 11 1710 11 0 c & s. 6 12 5 15 2 24 9 15 3 1!) 5 15 24 2 5 19 5 14 6 4 6 0 6 0 4 9 6 10 7 6 4 7 5 4 6 11 £ s. 24 6 23 8 13 24 8 23 11 23 11 21 9 23 19 ■22 14 22 7 22 1 25 7 5 2 22 12 23 19 27 2 5 17 23 11 5 16 23 15 2 4 1 19 1 8 1 14 1 17 2 1 1 18 1 18 1 16 1 9 1 15 2 15 1 18 1 11 2 1 1 1-1 1 19 1 18 p v h .a O £ s. 0 5 0 2 0 0 0 2 0 12 w £~T 1 5 0 15 5 0 14 3 0 17 0 11 0 19 1 1 0 3 0 17 0 o 1 15 0 13 0 2 0 9 0 15 1 4 0 8 0 6 1 0 1 10 0 9 0 10 0 18 1 1 1 1 1 4 0 14 0 10 1 15 1 1 0 19 Table C—Fluctuations in Ratio and Cost of Pauperism. 3 4 5 0 7 8 9 10 11 12 13 14 15 16 17 DISTRICT. B S3 < B PS PS w o H ft w pi 1 S w B < « ps o , PS PS > O * /Cirencester .. Stroud Westbury-on Severn .. Tewkesbury Leominster .. Hereford VUore Total /■Upton-oh- Severn .. Evesham Alcester Droitwich ... Bromsgrove ... Kidderminster Warwick Rugby Pershore Solihull \Atherstone ... Total Group 4 Total a, e 5°. a e- Paupers per 1,000 of Population, Less Lunatics d> Vagrants. percentage of Outdoor Paupers to Total Number, Less Lunatics and Vagrants. 1875 1885 1895 190 82 80 79 Total Expenditure on Relief. 1881-2 1891-2 1901-2 £ 9,325 13,734 6,959 4,538 5,177 12,025 4,299 56,057 7,035 5,212 6,437 6,852 8,652 11,563 13,701 6,366 5,234 4,081 3,726 79 78,859 79 134,916 £ 7,911 11,161 6,569 3,463 4,493 11,645 3,629 48,871 6,545 4,636 7,181 6,505 11,502 14,958 13,039 6,868 4,312 5,212 3,611 £ 9,859 13,500 8,817 3,935 5,132 14,081 5,038 60,362 84,369 133,210' 9,614 6 294 9,060 7,601 10,558 16,068 17,399 9,956 5,154 7,769 5,081 104,554 164,916 1901-5 £ 9.536 14,407 9,038 4,210 4,994 14,304 5,120 61,609 11,138 7 787 9,418 7,512 10,510 17,522 20,636 11,263 5,127 10,709 5,672 117,300 178,903 Expe jditure per Head of Population 1881- 8/9 6/8 5/11 7/0 7/1 7/0 10/0 7/2 6/1 6/10 6/8 5/3 5/5 5/8 5/2 4/8 7/9 3/10 5/2 5/6 6/1 1891-2 1901-2 1004-5 7/9 5/4 5/7 5/5 6/6 6/10 9/4 6/4 5/7 5/9 7/2 7/2 6/11 7/3 4/10 5/0 6/8 3/6 4/8 5/9 6/0 10/1 6/9 7/9 6/2 7/8 8/2 13/9 8/0 6)7 7/2 8/8 8/3 5/11 7/11 6/4 5/10 8/1 3/2 5/9 6/4 6/10 9/9 7/3 7/11 6/8 7/6 8/3 14/0 8/2 7/7 8/10 9/0 8/2 5/11 8/7 7/6 6/7 8/0 4/5 6/5 7/1 7/5](https://iiif.wellcomecollection.org/image/b24399735_0432.jp2/full/800%2C/0/default.jpg)