Report of the Royal Commission on the Poor Laws and Relief of Distress. : Appendix Volume XII. Memoranda by individual commissioners on various subjects.
- Royal Commission on the Poor Laws and Relief of Distress 1905-09
- Date:
- 1910
Licence: In copyright
Credit: Report of the Royal Commission on the Poor Laws and Relief of Distress. : Appendix Volume XII. Memoranda by individual commissioners on various subjects. Source: Wellcome Collection.
Provider: This material has been provided by London School of Hygiene & Tropical Medicine Library & Archives Service. The original may be consulted at London School of Hygiene & Tropical Medicine Library & Archives Service.
428/492 page 410
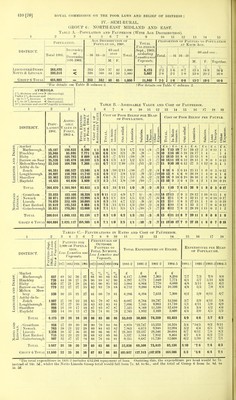
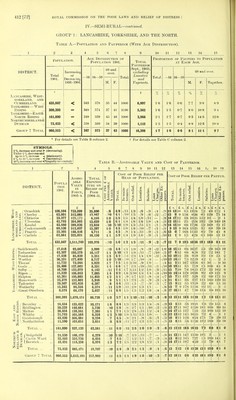
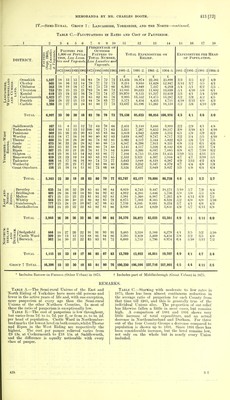
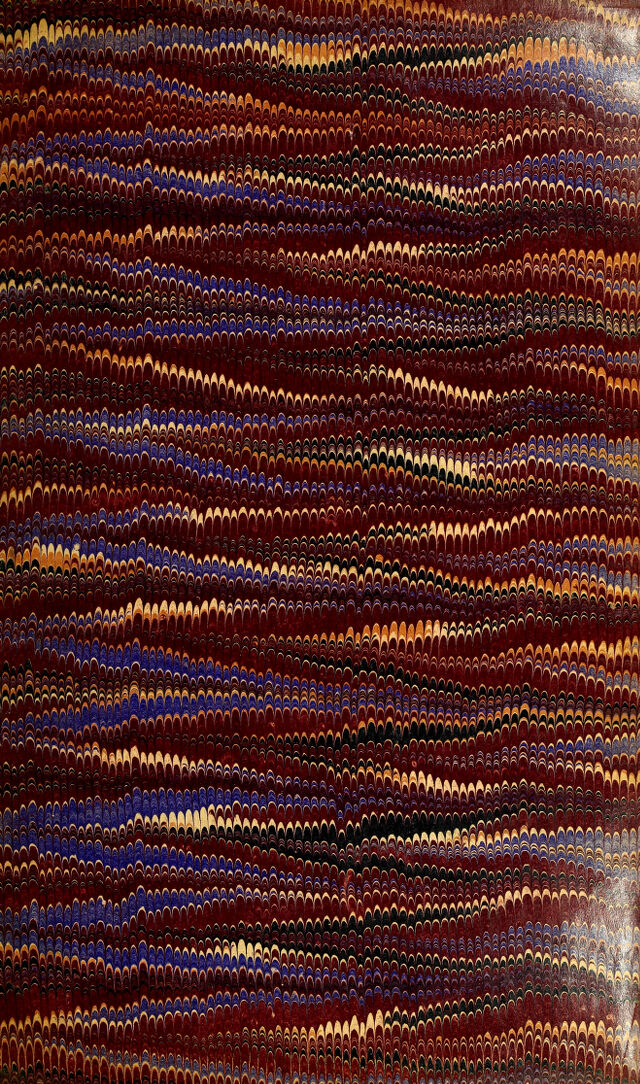
![IV.-SEMI-RURAL. GROUP 6: NORTH-EAST MIDLAND AND EAST. Table A.—Population and Pauperism (With Age Distribution). 6 10 11 12 13 14 15 DISTRICT. Population. Age Distribution of Populat.on, 1901. Total Paiperism (Sept., 1903). excluding Lunatics and Vagrants. Proportion of Paupers to Population at Each Age. Total 1901. Increasing or Decreasing 1891-1901. —16 16—5! 60 and over Total. Total. — 16 16—59 60 and over. M. F. M. F. Together. Leicester&Derbt Notts & Lincoln Group 6 Total 264,870 200,014 < 363 338 558 56S 37 44 42 50 1,000 1,000 t 6,173 5,667 7. 2-2 2-8 % 1- 6 2- 1 7. 0-7 10 7. 134 13 0 7. 18-9 20-2 7o 16-3 16-8 464,884 353 562 40 45 1,000 11,840 2-5 1-8 0-8 13-2 19-5 16-8 *For details see Table B column 2. |For details see Table C column 2. . , 2 % decrease and over> (decreasing). Under 2 % decrease and up to 5 % increase — (stationary). 6 % to 19 % increase < (increasing). 20 % increase and over <*(rapidly increasing) Table B.—Assessable Value and Cost of Pauperism. 10 11 12 13 14 15 16 17 18 19 DISTRICT. Popu- lation 1901. Assess- able Value in Force, 1903-4. a pa (• << J o S Wo d ca ° o & fa H B O pa ° < fa M o Pa Cost of Poor Relief per Head of Population. bi a h o -c Cost of Poor Relief per Pauper. e3 a Hi V o hIO .2 & OH / Market Harborough... Hinckley Blaby Barrow-on-Soar Melton Mowbray Ashby-de-la- Zouch Loughborough Shardlow Hayfield a . -a A ai O Total I Grantham .. Newark Lincoln East Retford Gainsborough Total Group 6 Total 19,187 23,940 24,973 25,528 22,210 44,241 34,897 55,462 14,432 264,870 33,033 30 871 74,670 25,619 35,821 200,014 464,884 £ 150,832 85,695 104,782 146,478 164,788 186,527 158,769 322 273 64,820 1,384,964 183,166 189,035 352,108 145,543 170,301 1,040,153 2,425,117 £ 8,290 7,771 8 009 10,599 7,308 12,546 11,710 12,410 3,809 82,452 1/1 1/10 1/6 1/5 -/ll 1/4 1/6 -/9 1/2 8/8 6/6 6/5 8/4 6/7 5/8 6/9 4/6 5/3 1/2 6/3 16,324 12,994 30,684 9,464 12,668 1/9 1/4 1/9 1/4 1/6 9/11 8/5 8/3 7/5 7/1 82,134 1/7 164,586 1/4 8/3 7/1 1/6 1/0 -n 1/3 1/2 710 1/2 -/8 -/ll 3/4 3/3 3/11 4/2 2/10 2/11 2/8 2/1 1/9 /ll 2/11 1/2 1/1 -/ll -/ll 1/1 4/9 3/8 4/7 3/11 3/5 1/0 4/2 1/0 3/5 1/7 ~/9 -/10 1/2 -/ll -/io 1/2 -/ll -/io 1/4 -/» -/9 1/1 -/ll -/7 -/9 -/6 AO -A -/i -/2 -/2 -/2 -/2 -/7 -/7 •/9 -A -/7 -/7 -A -/io -/2 -A £ s. 14 7 10 3 11 18 10 14 11 9 9 18 10 13 10 14 12 16 1/0 79 1/7 1/5 1/2 1/3 1/1 V- 1/2 -/9 -/io -AO 75 11 1 7ii -/6 /8 -A -/7 14 17 14 2 12 2 12 4 13 0 1/3 1/1 /ll 73 78 13 0 -/io 12 77 11 19 £ s. 13 19 14 16 15 11 11 19 10 10 8 3 8 6 9 18 9 £ s. 7 11 5 18 8 6 6 12 6 12 6 14 6 0 6 10 6 4 10 7 6 13 L3 2 11 ] 11 1 10 5 12 7 9 3 8 1 8 5 8 1 8 2 11 11 8 7 10 17 7 9 £ s. 26 13 24 17 25 15 28 11 27 5 £ s. 2 5 1 4 1 8 1 9 1 12 1 0 1 4 1 5 2 1 1 8 28 12 33 11 27 15 33 3 28 19 29 11 1 10 2 0 1 1 1 7 1 11 1 8 27 18 1 8 £ s. 0 11 0 1 0 5 0 5 0 4 0 8 1 10 0 5 0 15 0 18 0 5 0 6 0 2 £ s. 1 1 1 4 0 13 0 15 1 1 0 12 1 6 0 9 0 18 0 17 1 6 0 17 0 19 0 12 1 2 0 8 0 7 1 0 0 18 Tables C.—Fluctuations in Ratio and Cost of Pauperism. 3 4 5 6 7 8 9 10 11 12 13 14 15 16 17 18 DISTRICT. j e * % * J5 Ph p—i -S Paupers per 1,000 of Popula- tion. Less Lunatics and Vagrants. 187E 1885 189; L90; Percentage of Outdoor Paupeks to Total Number. Less Lunatics and Vagrants. Total Expenditure on Relief. 1875 1885 1895 19Q» 1881-2 1891-2 1901 2 1904-5 Expenditure per Head of Population. 1881-; 1891-2 1901-21904-5 / Market Harborough Hinckley Blaby Barrow-on-Soar Melton Mow bray ... Ashby-de-la- Zouch Loughborough I Shardlow ^ Hay field Total .. 457 728 630 779 536 1.007 895 908 233 6,173 29 24 § • /Grantham < j Newark gg< Lincoln g 2 East Retford (2$ hI l Gainsborough Total ... Group 6 Total 5,667 11,840 28 25 24 30 26 89 86 87 83 88 £ 6,117 5,297 5,084 6,7-52 6,286 6,097 7,096 7,525 2,765 86 53,019 8,970 7,963 21,303 5,337 9,255 85 52,828 85 105,847 £ 5,906 5,771 6,864 9,260 6,194 6,764 7,515 8,569 1,932 58,805 ■23,747 6,673 23,237 5,164 9,687 68,508 127,313 £ 7,365 7,049 7,770 8,943 7,653 10,797 9,983 11,530 3,169 74,259 15,253 9,948 28,546 7,952 11,720 73,419 147,678 £ 8,290 7,771 8,009 10;599 7,308 12,546 11,710 12,410 3,809 82,452 16,324 12,994 30,684 9,464 12,668 82,134 164,586 7/7 6/1 4/8 4/8 6/2 3/7 5/1 3/4 4/4 4/9 5/4 5/2 6/7 4/7 6/2 5/10 7/3 5/7 3/11 5/5 5/9 3/9 4/11 3/4 3/0 4/6 '14/5 4/4 6/11 4/4 5/10 5/3 *7/4 *5/8 7/8 5/11 6/3 7/0 6/11 4/11 5/9 4/2 4/5 5/7 9/3 6/5 7/8 6/3 6/7 7/4 6/4 6/6 6/5 8/4 6/7 5/8 6/9 4/6 5/3 6/3 9/11 8/5 8/3 7/5 7/1 8/3 7/1 *The total expenditure in 1891-2 includes £12,284 repayment of loan. Omitting this, the expenditure per head would be 7s. instead of 14s. 5d., whilst the Notts-Lincoln Group total would fall from Is. Ad. to 6s., and the total of Group 6 from 5s. 8d. to 5s. 2d.](https://iiif.wellcomecollection.org/image/b24399735_0436.jp2/full/800%2C/0/default.jpg)