Report of the Royal Commission on the Poor Laws and Relief of Distress. : Appendix Volume XII. Memoranda by individual commissioners on various subjects.
- Royal Commission on the Poor Laws and Relief of Distress 1905-09
- Date:
- 1910
Licence: In copyright
Credit: Report of the Royal Commission on the Poor Laws and Relief of Distress. : Appendix Volume XII. Memoranda by individual commissioners on various subjects. Source: Wellcome Collection.
Provider: This material has been provided by London School of Hygiene & Tropical Medicine Library & Archives Service. The original may be consulted at London School of Hygiene & Tropical Medicine Library & Archives Service.
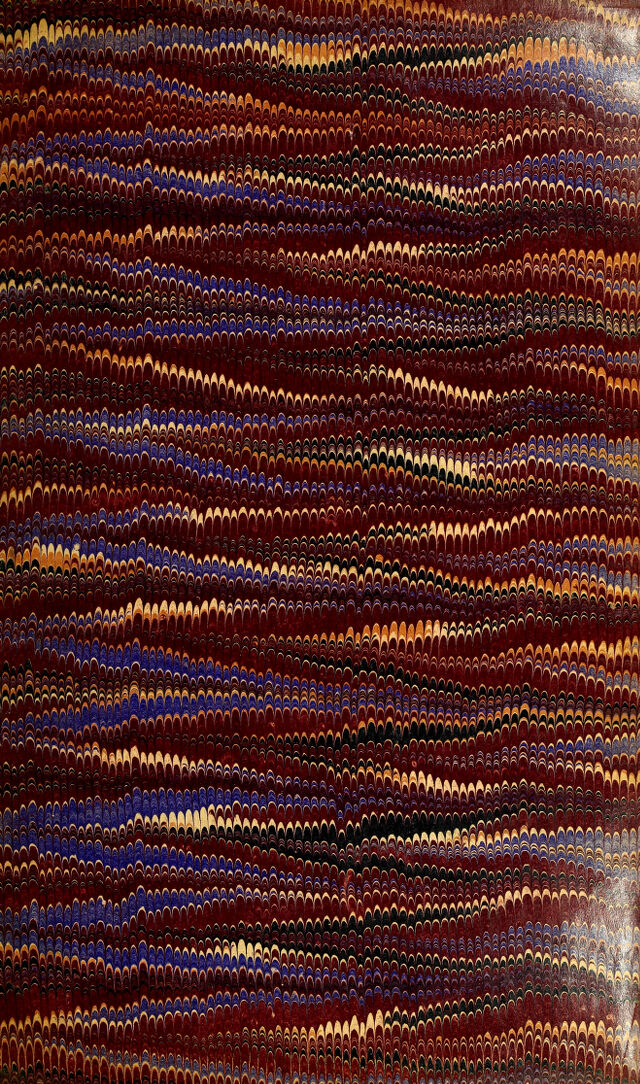
434/492 page 416
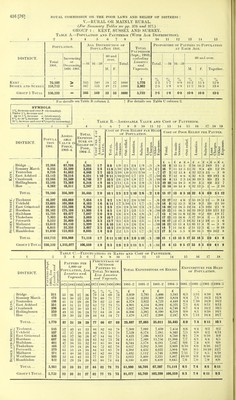
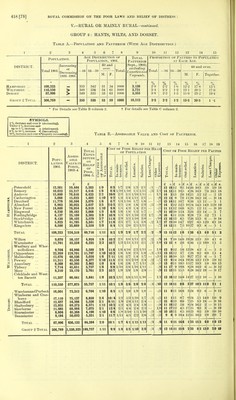
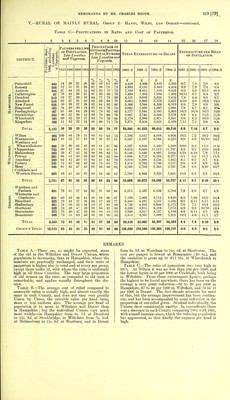
![V.—RURAL OR MAINLY RURAL. (For Summary Tables see pp. 376 and 377.) GROUP 1 : KENT, SUSSEX AND SURREY. Table A.—Population and Pauperism (With Age Distribution). 1 9 3 4 5 6 7 8 9 10 11 12 13 14 15 Population. Age Distribution of Population 1901. Total Pauperism Proportion of Paupers to Population at Each Age. DISTRICT. Total Increasing or —16 16-59 60 and over. Total. (Sept., 1903), excluding Lunatics Total. —16 16—59 60 and over. 1901. Decreasing 1891-1901. M. F. and Vagrants. M. F. Together. Kent Sussex and Surrey 70,580 159,712 > 345 347 540 553 58 49 57 51 1000 1000 t 1,770 3,962 /o 2 5 2-5 /o. 1-7 1-8 6/ /o 0-8 0-8 /o 10.2 11-2 % 15- 4 16- 3 °L to 12- 8 13- 8 Group 1 Total 230,292 346 549 52 53 1000 5,732 2-5 1-8 0-8 10-8 16-0 13-5 * For details see Table B column 2. T For details see Table C column 2. SYMBOLS. 2 % decrease and over > (decreasing). Under 2 % decrease and up to 5 % increase — (stationary). 6 % to 19 % increase < (increasing). 20 % increase and over <*(rapidly increasing). 1 Table B.- 5 6 -Assessable Value and Cost of Pauperism. 7 8 9 10 11 12 13 14 15 16 17 18 19 DISTRICT. Bridge Romney Marsh Tenterden East Ashford .. Cranbrook Hollingbourn .. Hoo Total Ticehurst Uckheld East Grinstead Horsham Hailsham Thakehain Petworth Midhurst Westbourne ... Hambledon Total Popula tion 1901. 12,384 6,585 8,756 13,112 12,944 12,546 4,262 70,580 16,297 23,608 18,001 28,162 15,728 7,302 8,529 13,612 6,815 21,630 159,712 Assess- able Value i Force, 1903-4. Total Expendi- ture on Relief of Poor, 1904-5 £ 67,704 33,299 41,063 70,214 52,349 73,269 18,311 356,209 £ 5,341 3,824 4,448 6,521 6,746 6,318 2,247 35,445 Group 1 Total 230,292 103,069 105,968 125,208 175,104 69,477 43,945 35,809 68,110 32,255 123,923 838,868 1,245,077 7,454 8,163 8,760 11,906 7,047 3,869 5,804 5,999 3,467 8,645 71,114 106,559 U3 Tfi CO o =3 1/7 2/4 2/2 1/10 2/7 1/9 2/5 Cost of Poor Relief per Head of Population. Eh O Eh 8/8 11/8 10/2 9/11 10/5 10/1 10/7 2/0 10/1 1/5 1/6 1/5 1/4 2/0 1/9 3/3 1/9 2/2 1/4 9/2 6/11 9/9 8/5 9/0 10/7 13/7 8/10 10/2 8/0 1/7 1/9 8/11 9/3 1/9 /10 3/10 1/10 2/6 2/11 2/3 2/5 1/8 1/7 2/0 1/4 1/6 2/1 3/5 1/6 2/0 2/2 1/10 2/0 2/1 2/9 1/0 2/10 2/9 1/5 1/10 2/2 2/4 1/11 1/11 1/7 1/8 1/8 1/5 1/10 2/0 1/1 1/10 2/5 1/6 2/7 3/6 2/6 2/4 1/5 2/0 1/11 1/9 3/0 2/10 2/3 2/7 2/9 3/5 2/6 1/10 1/7 2/3 1/5 1/8 2/6 2/5 2/4 2/4 1/7 1/10 2/1 O -S -hQ -/2 -13 -/I ■/I Js p- -/8 2/1 -/7 -/10 -/io 1/3 1/8 1,0 -/6 -/» -/H -/10 -p 1/0 1/0 -/10 -/8 1/2 /10 11 Cost of Poor Relief per Pauper. 19 10 15 14 15 17 12 17 14 0 14 19 15 12 13 1 17 12 16 17 16 12 14 7 17 3 15 1 15 6 2 n ' a I—I +3 £ 8. £ 13 15 5 11 13 5 12 15 4 12 0 6 13 2 5 14 18 5 10 14 4 13 0 5 10 12 4 12 15 12 18 11 16 16 11 13 16 ■22 17 13 11 11 14 6 2 5 9 5 19 5 16 6 12 6 5 14 13 15 5 17 13 9 5 17 2 - £ s. 34 14 31 9 32 12 32 8 30 19 30 5 32 13 32 4 35 18 34 9 34 4 33 19 36 0 37 10 32 14 33 11 31 12 30 16 33 18 33 8 £ s. 2 18 4 4 4 15 3 9 3 9 5 8 5 2 4 0 3 3 3 8 OQ V 02 £ Oh G&3 £ s. 0 3 0 1 0 19 0 2 0 3 0 5 0 13 0 1 0 10 0 4 0 4 Table O.—Fluctuations in Ratio and Cost of Paupee 3 4 5 6 7 8 9 10 11 12 13 1 12 0 14 1 10 1 9 1 12 0 17 1 13 1 6 1 9 0 19 2 8 1 8 1 9 14 15 16 17 18 DISTRICT. (Bridge Romney Marsh Tenterden East Ashford Cranbrook Hollingbourn *\Hoo Total ... Ticehurst... Uckfield ... East Grinstead Horsham ... Hailsham... Thakeham Petworth... Midhurst Westbourne Hambledon Total ... Group 1 Total Paupers per -n g 1,000 of ^ go- 8 ^ Population, Less] Lunatics and. Vagrants. 311 173 198 351 396 229 112 1,770 515 507 438 687 481 166 279 271 208 412 1875 1885 1895 1905 47 3,962 5,732 55 52 31 39 35 28 33 31 Percentage of Outdoor Paupers to Total Number, Less Lunatics and Vagrants. 1875 1885 1895 1905 29 77 33 88 23 86 28 87 24 83 32 81 28 84 38 84 25 81 33 77 20 83 66 67 78 75 69 Total Expenditure on Relief. Expenditure per Head of Population. 1881-2 £ 3,959 2,556 4,378 4,901 5,927 6,306 1,470 29,497 7,309 7,529 8,423 8,411 6,344 4,057 4,302 5,492 4,013 6,100 1891-2 £ 3,795 2,232 3,922 4,514 5,700 5,385 1,517 27,065 7,091 6,574 7,596 7,568 5,178 3,202 4,432 5,112 3,460 6,491 61,980 56,704 91,477 83,769 1901-2 £ 5,466 3,369 4,723 6,504 6,551 6,190 2,208 35,011 7,439 7,285 8,813 11,756 6,281 3,591 4,622 5,746 3,335 8,419 1904-5 1881-2 1891-2 1901-2 1904-5 £ 5,341 3,824 4,448 6,521 6,746 6,318 2,247 6/5 8/4 8/4 7/1 8/7 9/0 8/8 5/11 7/1 7/10 6/6 8/4 8/1 7/11 35,445 8/0 7,454 8,163 8,760 11,906 7,047 3,869 5,804 5,999 3,467 8,645 8/6 7/5 9/1 7/7 9/6 9/10 9/0 7/11 10/10 7/6 67,287 71,114 8/5 102,298 106,559 8/3 7/4 8/4 6/0 7/8 6/1 7/4 8/0 9/5 7/2 9/9 7/0 7/4 8/5 8/10 10/3 10/9 9/11 10/2 9/10 10/4 9/11 9/2 6/2 9/10 8/4 8/0 9/10 10/10 8/5 9/10 7/9 8/8 U/8 10/2 9/11 10/5 10/1 10/7 10/1 7/4 8/11 9/2 6/11 9/9 8/5 9/0 10/7 13/7 8/10 10/2 8/0 8/11 9/3](https://iiif.wellcomecollection.org/image/b24399735_0442.jp2/full/800%2C/0/default.jpg)