Report of the Royal Commission on the Poor Laws and Relief of Distress. : Appendix Volume XII. Memoranda by individual commissioners on various subjects.
- Royal Commission on the Poor Laws and Relief of Distress 1905-09
- Date:
- 1910
Licence: In copyright
Credit: Report of the Royal Commission on the Poor Laws and Relief of Distress. : Appendix Volume XII. Memoranda by individual commissioners on various subjects. Source: Wellcome Collection.
Provider: This material has been provided by London School of Hygiene & Tropical Medicine Library & Archives Service. The original may be consulted at London School of Hygiene & Tropical Medicine Library & Archives Service.
440/492 page 422
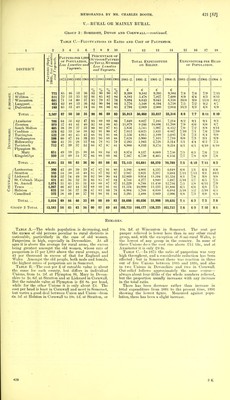
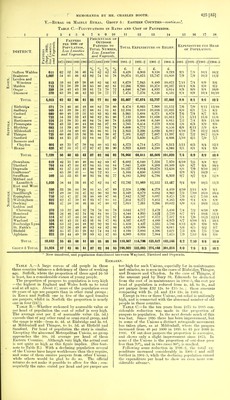
![V.—RURAL OR MAINLY RURAL—continued. GROUP 4: SOUTH AND EAST MIDLANDS. Table A.—Population and Pauperism (With Age Distribution). 1 2 3 4 5 6 7 8 9 10 11 12 13 14 15 Population. Age Distribution of Population 1901. Total Pauperism Proportion of Paupers to Population at Each Age. DISTRICT. o M O til ■ w>.5 3 ■a «rt —16 16-59 60 and over. ~£ (Sept., 1903), excluding Lunatics Total. —16 16-59 60 and over. % o H Increai Deere 1891- M. F. o H and J^ctffTants, M. F. Together. Berkshire Oxford and Bucks Herts, Beds, and Cambs Northampton and Hunts * 109,079 112,843 141,032 122,657 > > > 349 358 353 341 542 525 531 536 52 55 55 58 57 62 61 65 1000 1000 1000 1000 t 2,522 4,271 4,816 3,055 /o 2 3 38 3 4 2-5 /o 1-7 2 4 20 1-6 /o 0- 9 1- 3 10 0-8 /o 10-0 16 0 149 10-9 °/ IO 12- 3 22-7 22-6 13- 7 °/ 10 111 19-5 19 0' 124 Group 4 Total 485,611 > 351 533 55 61 1000 14,664 30 1-9 10 131 18-1 15-7 For details see Table B column 2. t For details see Table C column 2. SYMBOLS. 2 % decrease and over > (decreasing). Under 2 % decrease and up to 6 % Increase — (stationary). 6 % to 19 % Increase < (increasing). 20 % Increase and over<»(rapidly increasing). 1 3 Table B.—Assessable Value and Cost of Pauperism. 5 6 7 8 9 10 11 12 13 14 15 16 17 18 19 DISTRICT. w X , c- ( a PS w O 00 / Q N Wokingham Wantage Wallingford Easthampstead Hradfield Hungerford .. Faringdon Total ^ Witney Chipping Norton .. Wo 'dstock .. liicester Thame Buckingham.. Amersham Winslow* Total ( Royston Ampthill Newmarket .. Ely North Witch- ford Hatfield Welwyn Buntingford .. Caxton and Arrington Linton Total to H t < 5 / Brackley Daventry Thrapston Oundle Huntingdon St. Ives St. Neots Towcester *> Brix worth Total Group 4 Total o < Pm o 17,937 15,608 13,786 15,757 18,117 15,562 12,312 109,079 19,283 16,004 12,071 12,435 13,023 10,636 22,357 7,034 112,843 16,026 21,323 32,103 20,096 16,994 7,551 2,265 5,020 8,397 11,257 141,032 10,718 17,205 14,941 10,494 18,095 14,776 13,879 10,720 11,829 122,657 485,611 w J O 5? w 2 £ 131,938 88,053 106,757 81,725 134,346 68,828 82,708 694,355 79,139 68,081 69,240 64,897 59,186 59,364 81,482 37,818 519,207 67,575 114,244 177,278 95,998 84,104 73,200 28,573 21,341 29,645 55,950 747,908 61,915 112,869 63,711 55,958 121,579 67,334 90,411 54,206 82,321 710,304 2,671,774 ►h iri a w I i 0 B M O t> h H H O £ 8,149 6,068 8,584 7,483 4,741 6,096 5,738 46,859 7,939 8,626 7,708 5,616 7,104 5,665 11,226 4,429 58,313 7,799 11,857 14,287 7,492 7,104 4,980 2,089 2,884 4,904 6,942 70,318 4,256 7,606 6,521 4,756 6,961 6,177 5,719 4,837 4,177 51,010 226,500 o w ■Ma S w < 1/3 1/5 1/7 1/10 -/8 1/9 1/5 1/4 2/0 2/6 2/3 1/9 2/5 1/11 2/9 2/4 2/3 2/4 2/1 1/7 1/7 1/8 1/4 1/5 2/8 3/4 2/6 1/11 1/4 1/4 2/1 1/8 1/2 1/10 1/3 1/9 1/0 1/5 1/8 Cost of Poor Relief feu Head of Population. < EH C 9/1 7/9 12/5 9/6 5/3 7/10 9/4 8/7 8/3 10/9 12/9 9/0 10/11 10/8 10/0 12/7* 10/4 9/9 11/1 8/11 7/5 8/4 13/2 18/3 11/6 11/8 12/4 10/0 7/11 8/10 8/9 9/1 7/8 8/4 8/3 9/0 7/1 8/4 9/4 a 5 2/0 1/10 3/2 2/5 1/5 1/6 1/11 2/0 1/7 1/7 2/4 1/5 1/11 1/8 1/8 4/3* 1/10 1/4 1/4 1/8 1/6 1/2 1/11 3/8 2/2 1/9 2/0 1/7 1/3 1/9 2/3 2/1 1/10 1/7 2/1 1/0 1/10 2/4 2/3 1/0 1/0 -P 2/10 3/1 1/10 2/7 5/1 4/11 3/10 4/8 3/10 4/7 4/1 4/2 4/2 5/4 2/8 2/1 3/5 4/4 4/1 3/11 5/2 4/7 3/9 2/10 3/4 2/5 1/2 2/2 3/1 1/4 4/5 1/11 2/6 3/1 1/4 1/9 1/7 2/2 1/3 1/5 1/8 1/10 1/0 1/8 2/0 1/8 1/5 1/8 1/8 2/7 3/4 1/2 1/8 2/6 1/9 1/8 1/4 1/2 1/5 1/3 1/4 1/8 1/4 I/O 1/4 1/7 1/11 1/9 2/9 2/3 1/5 2/0 2/1 2/0 1/8 1/10 1/1.0 1/11 2/0 2/3 1/6 2/5 1/10 1/8 1/9 1/4 1/6 1/3 2/5 4/1 3/1 2/5 2/1 1/9 1/6 1/5 1/1 2/1 1/8 1/8 1/H 1/10 1/7 1/8 1/10 o 2/3 1/4 /6 -/I /■- /2 -/I -/6 1/1 -n -/i ~/6 -/3 /S -/2 -/8 1/4 -12 7s Pi 1/5 -/8 1/9 1/0 -/6 -/4 -/9 -/H /7 -/8 /ll -/7 -/ll -/10 -/5 -m /8 -76 -/6 -/9 -/7 -/9 1/5 2/l0 1/2 -/7 1/2 /9 -/8 -/1( 1/2 1/0 -/7 -/8 -/10 -/5 -/9 Cost of Poor Relief per Pauper. E-i O H £ s. 15 0 9 18 26 5 21 18 21 17 10 8 10 17 14 17 10 18 9 18 13 9 10 15 12 15 15 11 11 16 12 12 0 10 18 11 18 13 3 14 12 13 1 16 13 17 14 12 8 11 19 12 3 12 12 11 13 12 12 13 16 19 8 13 8 13 10 17 0 10 15 16 8 13 15 13 2 a cp £ 14 18 10 14 12 IS 7 16 12 9 11 4 6 4 69 4 i 12 95 223 13 90 171 12 11 13 9 7 5 07 97 106 9 6 11 2 15 13 12 18 7 37 196 12 66 0 11 17 11 16 11 15 12 3 11 12 19 6 167 11 16 6 7 £ s. £ s. 13 23 22 623 9 18 4 — -c O £s. 7 3 5 10,2 105 35 4 15 4 ■> 22 5j5 14 24 13 2 13 17 23 142 8 t 13 12 166 924 62 30 30 1& I 11 6 6 0 25 12 7 12 9 11 7 5 5 ] 025 9 30 18 10 13 10 18 6 18 23 £ s. 15 3 3 4 r 9 1 111 91 18 73 ] 5 1327 25 02 18 3 1 826 10 28 11 06 1924 162 100 10 14 9 5 15 30 16 180 1 IK) 1 13 0 2 00 21 174 103 6 2 2 0 12 4 mi 12 56 426 182 40 100 19 21 02 5 2 1 34 152 '22 23 2.) 26 26 22 0 22 18 23 142 140 91 6 12 6 6 3 24 142 100 9fl I 141 8 2 18 0 2 16 34 00 2 4 3 13 0 4 0 17 7 L6 0 10 11 11 1 2 i a 5 15 14 5 12- I 2 0 18 5 1 18. 1 1 2 15 0 10- 1 15 * The cost here probably includes some paupers belonging to other Unions. In 1903-4 In-maintenance cost £760 (or 2s. 2d. per head of popu'ation) ; in 1904-5 the cost was £1,488 (or 4s. 3d. per head). This increase was balanced by a rise in Other Receipts, from £141 in 1903-4 to £1,172 in 1904-5.](https://iiif.wellcomecollection.org/image/b24399735_0448.jp2/full/800%2C/0/default.jpg)