[Report 1934] / Medical Officer of Health, Manchester City.
- Manchester (England). City Council. n 88637066.
- Date:
- 1934
Licence: Attribution 4.0 International (CC BY 4.0)
Credit: [Report 1934] / Medical Officer of Health, Manchester City. Source: Wellcome Collection.
25/372 page 21
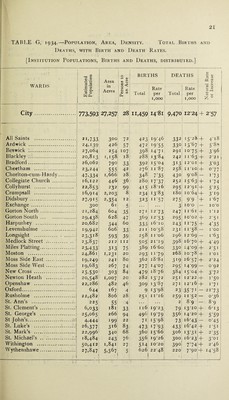
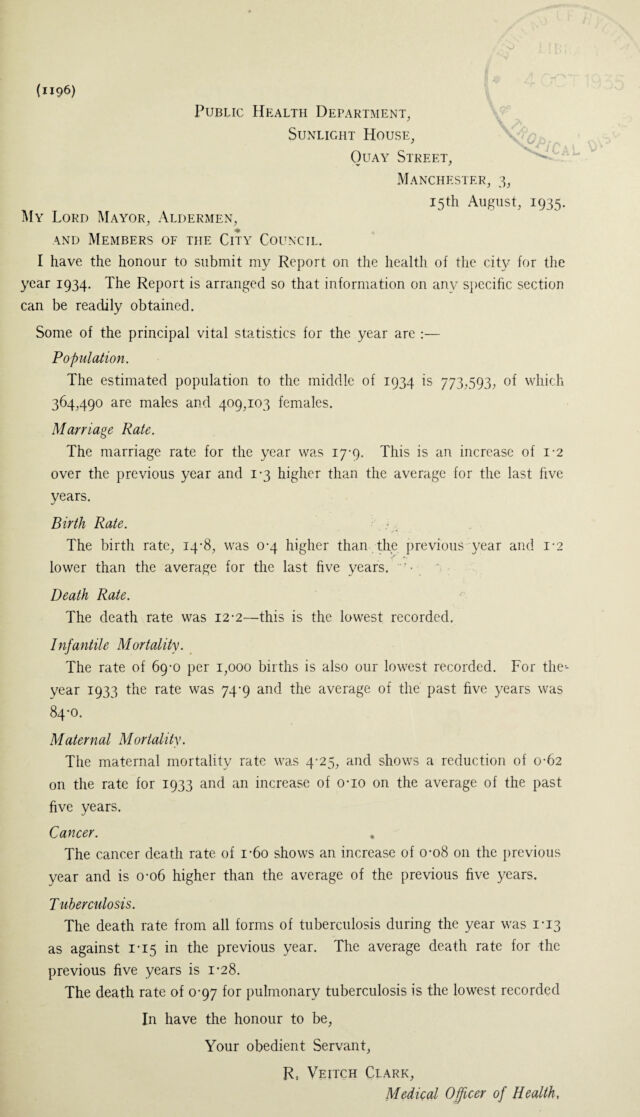
![TABLE G, 1934.—Population, Area, Density. Total Births and Deaths, with Birth and Death Rates. [Institution Populations, Births and Deaths, distributed.] WARDS Estimated Popuiation Area in Acres Persons to an Acre BIRTHS DEATHS 1 Natural Rate ot Increase I Total Rate per 1,000 Total Rate per 1,000 City. ,;:j 773,593 27,257 28 . 11,459 I4‘8i 9,470 12*24 + 2-57 All Saints . 2L733 3°° 72 423 19*46 332 15*28 + 4*18 Ardwick . 24D39 426 57 472 19*55 33° 15*67 + 5*8* Beswick . 27,064 254 107 398 14*71 291 Io*75: + 3*96 Blackley . 20,813 Li58 18 288 13*84 242 11*63 + 2*2 I Bradford. 26,062 790 33 392 i5'°4 313 I 2*01 + 3*03 Cheetham . 23,244 555 42 276 11 *87 258 11*10 + 0*77 Chorlton-cum-Hardy. 47,334 1,666 28 348 7*35 43° 9*08 — 1 ‘73 Collegiate Church . 16,122 446 36 280 17*37 252 15*63 + i*74 Collyhurst . 22,853 232 99 415 1816 295 12*91 + 5'25 Crumpsall . 16,914 2,203 8 234 i3'83 180 10*64 + 3*i9 Didsbury. 27,915 2,354 12 323 [I*57 275 9*9 + 1 *67 Exchange . 3°° 61 5 ... • • • 3 10*0 — 10*0 Gorton North. 21,284 604 35 271 12*73 247 11 *61 + 1*12 Gorton South. 29,438 628 47 369 12*53 295 M O b + 2*5[ Harpuihey . 20,682 344 60 333 16*10 243 n*75 + 4*35 Levenshulme . 19,942 606 33 211 10*58 231 11*58 — 1 *oo Longsight . 2 3,318 593 39 258 11 06 296 12*69 — 1*63 Medlock Street . 23,837 212 112 5°5 21*19 398 16*704- 4*49 Miles Platting. 23,433 3i3 75 389 1660 33° 14*09 -f 2*5I Moston . 24,861 1,231 20 293 11 *79 268 10*78 -f- 1 01 Moss Side East . 19,249 241 80 362 18 *81 3T9 16-57 -j- 2*24 Moss Side West. 19,683 267 74 277 14*07 295 !4*99 — 0*92 New Cross . 25,53° 3°3 84 479 18*76 384 15 *°4i + 3‘72 Newton Heath . 20,548 1,007 20 282 13*72 2 51 I 2*22 + 1*50 Openshaw . 22,286 482 46 3°9 13*87 271 I 2*l6 4- I*7» Oxford. 644 167 4 9 13*98 23 35*71 — 21*73 Rusholme . 22,482 806 28 25‘ 11*16 259 11 *5 2 — 0*36 St. Ann’s .j. 225 55 4 • • • • . • 2 8*9 — 8*9 St. Clement’s .. 6,033 181 33 116 I9’23 79 iyio + 6*13 St. George’s . 25,065 266 94 496 19*79 356 14*20 + 5*59 St John’s..b.t 4,444 199 22 7i I5'98 73 16*43 — o*45 St. Luke’s ..1.+ 26,377 3l6 83 473 17*93 433 16*42 + **5i St. Mark’s . 22,996 34° 68 360 15*66 306 I3‘3I] + 2*35 St. Michael’s . 18,484 243 76 356 19*26 300 16*23' + yoi Withington .. 50,412 1,841 27 5I4 10*20 39° 7*74; + 2*46 Wythenshawe .... .:. • • •• + 27,847 « 5,567 5 626 22*48 220 • 7‘9o + 14*58 !](https://iiif.wellcomecollection.org/image/b29785558_0025.jp2/full/800%2C/0/default.jpg)