Annual returns of the European army of the Bengal Presidency from 1858 to 1869, of the native army since its reorganization in 1861, and of the jails for each year from 1859 / by James L. Bryden.
- Date:
- 1871
Licence: Public Domain Mark
Credit: Annual returns of the European army of the Bengal Presidency from 1858 to 1869, of the native army since its reorganization in 1861, and of the jails for each year from 1859 / by James L. Bryden. Source: Wellcome Collection.
Provider: This material has been provided by Royal College of Physicians, London. The original may be consulted at Royal College of Physicians, London.
71/730 (page 39)
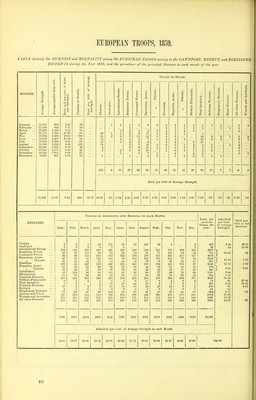
![TABLE showing the SICKNESS and 3WETALITY among the EUEOFEAN TROOPS serving in the BINAFORE, BENARES, and OUBE BISTRICTS during the gear 1859, and the pi-evalence of the principal Biseases in each month of the gear. MONTHS. January ... February ... Blarch .ipril May J une. July August Sepfember. October .. November.. December.. 20,814 19,371 19,845 19,333 18,667 18,359 18,182 16,743 1.5,221 14,041 14,811 14,433 17,435 1,723 ] ,748 3,862 2,015 2,111 2,193 2,273 2,086 1,840 1,836 1,798 1,420 10-92 39 26 61 94 99 108 103 123 92 65 47 31 50-21 Causes of Death. Cholera. Small-pox. j Intermittent Fevers. Eemittent Fevers. Continued Fevers. Dysentery, Acute. ,, Chronic. C3 8 u R Hepatitis, Acute. „ Chronic. Phthisis Pulmonalis. Heat Apoplexy. Delirium Tremens, Eespiratory Diseases. Heart Diseases. AU other Diseases. Wounds and Acc-idents. 1 1 1 14 3 6 3 3 2 1 2 1 8 3 1 3 4 1 4 1 1 l 8 14 4 6 5 6 1 1 1 1 3 6 io 14 37 4 6 7 4 1 1 1 3 9 15 10 39 2 4 5 3 3 4 2 3 11 l 8 15 30 5 4 5 2 15 '1 4 3 10 3 12 22 5 1 7 3 6 24 1 5 2 43 'l 2 6 31 3 6 8 8 4 2 1 6 2 14 4 4 30 4 4 18 1 4 1 2 1 4 1 2 'l 9 7 14 4 3 9 2 1 1 3 '4 2 2 1 2 2 3 7 10 2 5 3 1 2 3 5 1 1 2 7 '4 4 3 2 1 1 3 97 1 7 56 86 256 39 45 79 42 28 49 11 20 14 40 8 Died per 1000 of Average Strength. •05 •40 3^20 14-64 2-57 2-40 •63 NUMBEE OF AdMISSIOITS INTO HOSPITAL IN EACn MONTH. Total DISEASES. Admissions during the i'ear. Jany. Feb. Mar. April. May. June. July. Aug. Sept. Oct. Nov. Dec. Cholera 1 1 8 14 14 25 23 73 24 6 3 197 1 Srnall-pox (! 1 4 3 1 17 Intermittent Fevers 167 157 220 348 318 291 307 213 112 343 720 631 3827 Remittent Fevers 40 64 85 277 253 363 490 218 200 577 529 241 3336 Continued Fevers 132 151 590 736 644 650 1031 639 520 746 687 287 6813 Dysentery, Acute 159 149 219 357 354 307 317 324 222 148 111 87 2754 ,, Chronic 27 27 35 27 36 37 58 49 31 45 25 20 417 Diarrhcea 178 191 294 387 333 312 325 347 296 142 129 138 3073 Hepatitis, Acute 82 70 83 92 91 84 91 88 109 59 36 41 926 ,, Chronic 48 41 34 26 53 37 52 41 27 31 29 23 445 Ophthalmia 184 218 253 253 202 159 182 141 143 215 132 102 21S4 lUieumatism 1.57 128 1-25 119 110 87 93 98 90 74 74 84 1244 Venereal Diseases 891 776 822 794 783 589 684 660 541 578 563 493 8172 Phthisis Pulmonalis 5 13 7 7 16 11 12 14 8 7 11 4 115 Heat Apoplexy 1 3 1 10 42 57 4 4 2 1 131 Delirium Tremens ' 9 8 6 9 13 7 23 8 12 14 16 ' 5 7 129 Epilepsy 9 9 5 12 4 3 7 7 4 10 5 83 Respiratory Diseases ... 143 124 118 115 116 69 93 81 84 90 80 67 1180 Abscess and Ulcer 171 167 183 210 187 216 262 181 176 141 145 153 2192 Wounds and Accidents ... 168 127 149 124 130 78 100 73 73 70 73 107 1272 AU other Diseases 264 264 310 308 308 290 340 283 308 219 207 191 3390 2840 2085 3560 4216 3983 3675 4534 3549 2987 3513 3570 2634 41,796 Admitted per cent, of Average Strength in each Month. 13-64 13-86 IS'OO 21-81 j 21-34 20-00 24-93 j 21-19 19-62 25-02 24-10 18-60 239 Admitted per cent, of Average Strength. 112 •09 80-00 18-13 17- 57 7-84 12-4.9 7- 11 46-73 •65 •75 •73 •47 8- 75 12-53 7-21 18- 81](https://iiif.wellcomecollection.org/image/b24749291_0071.jp2/full/800%2C/0/default.jpg)