Annual returns of the European army of the Bengal Presidency from 1858 to 1869, of the native army since its reorganization in 1861, and of the jails for each year from 1859 / by James L. Bryden.
- Date:
- 1871
Licence: Public Domain Mark
Credit: Annual returns of the European army of the Bengal Presidency from 1858 to 1869, of the native army since its reorganization in 1861, and of the jails for each year from 1859 / by James L. Bryden. Source: Wellcome Collection.
Provider: This material has been provided by Royal College of Physicians, London. The original may be consulted at Royal College of Physicians, London.
73/730 (page 41)
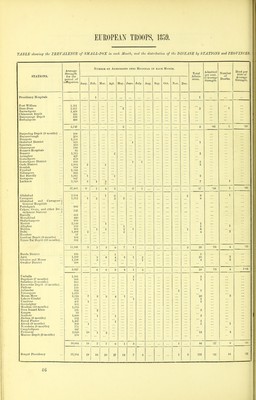
![TABLE shoiving the SICKNESS and MORTALITY among the EUROPEAN TROOPS serving in the AGRA DISTRICT and in CENTRAL INDIA during the lear 1859, and the xirevalence of the principal Diseases in each month of the year. 0) ^1 bo Causes or Death. M o k <1 > O a MONTHS. Strength. number ds k per cent, th. of Deaths, ■r 1000 ol th. M o OJ a 0) s l> y, Acute. Chronic. 1, Acute. Chronic. a 0 e 0 Tremens. ory Diseas( seases. : Diseases. and Accid( age age % a Ut mitl tten s .g nter 8 titis <1 a irat' ■c a a 3 'o .a !=1 o a 1 a 0 epa D 0 3 0 -A < P M P a Ph M P W W January ... 1 222 81 6-91 1 1 February... 71 4-07 2 1 1 March 2,751 191 7-00 6 3 1 1 April 3,139 242 7-71 14 1 2 6 1 2 1 1 May 4,562 330 7-24 13 1 1 3 1 1 3 1 2 June 4,509 b77 8-38 16 1 2 1 1 1 4 1 1 1 1 July 4,295 408 9-51 25 5 1 2 2 2 1 1 10 1 August 4,832 431 9-00 17 2 3 2 2 5 1 1 1 September . 4,395 494 11-25 19 1 3 6 1 1 1 2 1 2 '1 October ... 4,390 502 11-45 23 1 1 2 4 2 '4 1 1 1 1 1 4 November.. 5,761 457 7 94 24 3 2 2 6 3 4 2 1 1 December... 5,116 379 7-00 14 ::: 5 1 1 1 1 1 2 9 4 8 11 17 32 6 13 15 8 2 21 4 8 2 12 1 Died per 1000 of A verage Strength. 3,927 331 8-43 173 44-05 2-30 1-02 2-03 2-80 4-33 8-15 1-52 3-31 3-82 2-03 •51 5-35 1-02 2-03 •61 3-05 •25 DISEASES. Number of Admissions into HosriTAL is each Month. Total Ad- missions during the Year. Admitted per cent, of Average Strength. Died per cent, of Ad- missions. Jany. Feb. March. AprU. May. June. July. Aug. Sep. Oct. Nov. Dec. Cholera 1 2 2 26 4 2 3 40 1^02 22-50 Small-pox ' 6 6 9 4 1 3 29 •74 1400 Intermittent Fevers 121 105 127 157 343 378 363 326 394 722 56O 383 3979 Remittent Fevers 9 » 4 9 140 286 3S5 182 33 1057 j- 153-65 •59 Continued Fevers 1 1 '82 87 113 112 236 73 96 66 105 26 998 Dysentery, Acute 3 2 10 10 25 23 29 64 63 50 60 31 370 j 10-69 9-05 ,, Chronic Diarrhoea 1 1 2 3 3 9 5 10 12 50 ' 4 22 43 39 80 61 112 145 118 65 84 56 829 2111 1-56 Hepatitis, Acute 3 3 8 8 20 10 8 19 18 26 20 16 159 ] 6-14 9^54 ,, Chronic Ophthalmia 4 3 4 10 8 8 4 8 7 10 16 82 3 7 41 20 43 29 16 51 28 28 30 26 322 8-20 Rheumatism 7 7 14 8 18 12 30 21 22 25 24 • 23 211 5-37 Venereal Diseases 35 63 104 86 169 129 92 110 4 90 80 131 110 1199 30-,53 Phthisis PuknonaUs 2 2 2 2 2 14 •35 14-30 Heat Apoplexy 2 ' 7 9 17 8 3 1 1 48 1-22 43-75 Delirium Tremens ' 1 2 6 3 5 3 3 3 28 •71 14 30 Epilepsy 2 3 1 5 2 2 1 5 23 •,58 1-93 Respiratory Diseases 3 ' 8 ' 38 36 43 30 35 23 20 27 72 64 404 10 29 Abscess and Ulcer 14 55 29 44 38 75 34 29 39 30 45 439 11-18 Wounds and Accidents ... 14 13 21 18 32 10 17 18 14 15 29 28 229 5 83 All other Diseases 11 24 42 59 66 61 122 76 41 48 61 70 681 17-34 214 281 596 585 1040 921 1214 1126 1250 1599 1412 950 11,191 Admitted per cent. of Average Strength in each Month. ■ 17-51 15-45 21-66 lS-63 22-80 20-50 [28-26 22-85 28-41 j 36-'12 24-51 17-44 235-00](https://iiif.wellcomecollection.org/image/b24749291_0073.jp2/full/800%2C/0/default.jpg)