Age and length of service as affecting the sickness and mortality of the European army : and aggregate of the statistics of the army for the ten-year period, 1860-69 / by James L Bryden.
- James Bryden
- Date:
- 1874
Licence: Public Domain Mark
Credit: Age and length of service as affecting the sickness and mortality of the European army : and aggregate of the statistics of the army for the ten-year period, 1860-69 / by James L Bryden. Source: Wellcome Collection.
Provider: This material has been provided by Royal College of Physicians, London. The original may be consulted at Royal College of Physicians, London.
74/82
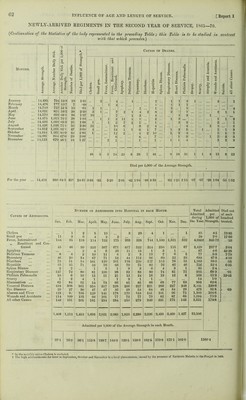
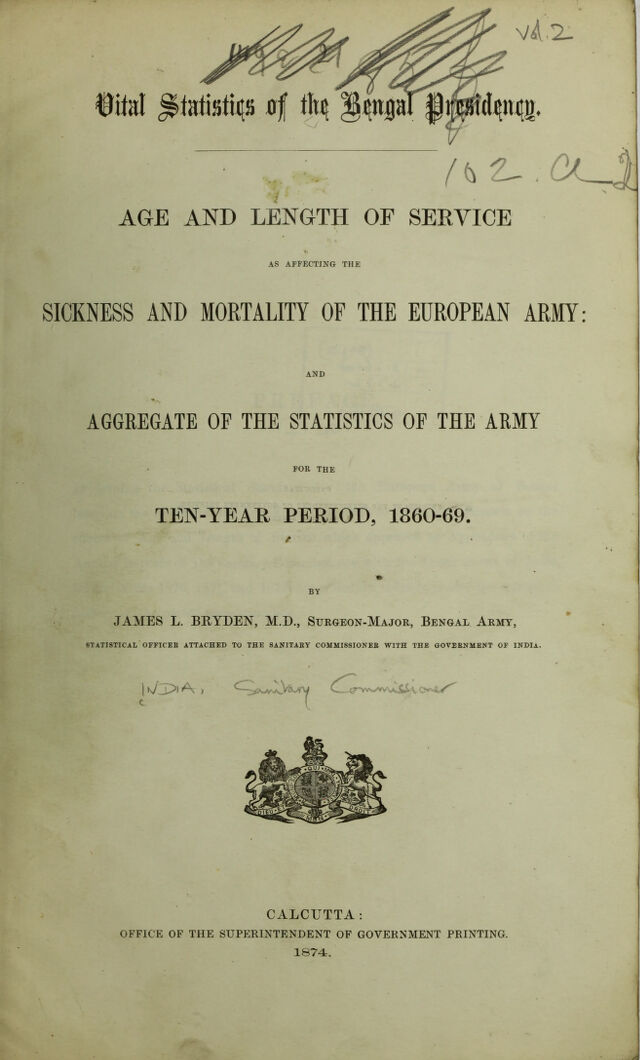
![NEWLY-ARRIVED REGIMENTS IN THE FIELD, 1858. {The aggregate of the Sichiess and Mortality among the European Troops employed on Field Service in the Gangetic Frovinces and in Oude and Rohilcund during the Year.) {The Army of Central India was not on the Strength of the Bengal Presidency in 1868, and is not included in this Statement.) Months. Average Strength. Average Number Daily Sick. 1 Number Daily Sick per 1,000 of Strength. Number of Deaths. Died per 1,000 of Strength. Causes oe Deaths feom Disease.* Cholera. Small pox. Fevers. Apoplexy. Delirium Tremens, Dysentery, Diarrhoea. 1 Hepatitis. Respiratory Diseases. Heart Diseases. Phthisis Pulmonalis. All other causes. January 26,234 2,170 82-7 85 3-24 3 2 1 13 1 33 7 11 10 3 2 February 27,001 2,001 74-1 54 2-00 1 15 2 17 8 4 1 ”’l 4 1 March 28,394 2,419 85-2 101 3-56 5 5 28 1 37 8 5 5 7 April 29,507 3,353 113-7 249 8-44 5 29 86 9 75 23 11 2 '4 5 May 30,663 4,214 137-4 818 26-68 8 28 173 415 5 110 26 17 8 1 ■3 24 June 28,824 4,526 157-0 398 13-81 1 6 80 177 66 20 18 12 3 3 12 July 29,867 4,198 140-6 206 6-90 6 46 40 3 56 12 24 4 1 4 10 August .30,376 4,348 143-1 287 9-45 7 42 3 1 160 29 23 1 5 1 7 9 September 31,145 4,786 163-7 363 11-66 2 64 15 2 185 42 29 6 5 13 October 31,535 4,335 137-5 247 7-83 2 60 2 4 102 33 19 6 ’2 7 10 November 31,130 3,110 100-0 148 4-76 32 1 53 12 20 10 1 5 14 December 34,868 2,916 83-6 1 123 3-53 '2 18 1 53 9 19 8 2 3 7 1 41 71 657 666 17 947 229 200 77 12 48 114 Died per 1,000 of the Average Strength. For the year ... 29,962 3,531 1 117-8 3,079 102-76 1-37 2-37 21-93 22-23 •57 39-25 6-67 2-57 1 •40 1-60 380 Causes op Admissions. Numbee op Admissions into Hospital in each Month. For the Year. Admitted per 1,000 of Strength. Died out of each hundred treated. Jan. Feb. M.ar. April. May. June. July. Aug. Sep. Oct. Nov. Dec. Cholera 5 2 22 17 18 14 19 21 20 5 2 5 150 6-0 27-33 Small pox 10 27 145 56 39 7 8 292 9-7 24-32 Fever, Intermittent C „ Remittent ]706 836 1,710 3,672 5,908 6,547 5,190 5,011 4,146 3,458 1,675 1,090 39,949 1333-3 1-64 „ Continued 1 Apoplexy 1 3 5 14 911 536 135 21 28 9 2 6 1,671 55-8 39-85 Delirium Tremens 13 5 5 5 12 18 27 19 21 28 19 13 185 6-2 9-19 Dysentery 264 234 312 587 448 398 494 1,221 1,033 907 558 485 6,941 231-7 13-64 Diarrhoea 386 360 704 894 933 677 948 1,393 1,094 834 464 408 9,095 303-5 2-52 Hepatitis 68 92 118 138 149 189 169 205 235 282 217 204 2,066 69-0 9-68 Respiratory Diseases 200 241 218 259 197 184 233 232 189 234 260 320 2,767 92-3 2-78 Phthisis Pulmonalis 5 10 6 7 14 30 27 19 16 21 14 10 179 6-0 26-81 Rheumatism ... 120 185 179 170 123 125 210 208 174 227 195 255 2,171 72-4 'I Venereal Diseases 512 554 622 526 480 485 660 712 678 836 861 1,181 8,107 270-6 1 Eye Diseases ... 89 167 208 190 116 143 204 226 151 212 151 199 2,056 68-6 !■ .5, Abscess and Ulcer 280 316 400 410 540 539 677 579 510 496 370 408 5,525 184-4 Wounds and Accidents 488 418 876 524 386 236 256 279 238 352 397 413 4,863 162-3 1 All other Causes ... : 268 315 374 474 724 766 795 782 659 703 449 509 6,818 227-6 J 3,405 3,748 5,786 8,032 1 11,015: 10,926 10,051 10,928 9,192 8,604 5,634 5,514 92,835 i j Admitted per 1,000 of the Average Strength in each Month. ! j 129-8 138-8 203-8 272-2 359-2 1 ! 379-1 336-5 359-8 295-1 272-8 181-0 158-1 1 3098 4 • This Table provides an estimate of the loss from disease likely to follow the employment in the field of a newly-landed army. All deaths from violence are excluded. The death-rate here given does not, however, show the full extent of the loss arising from exposnre in the field; for in the hospitals at Calcutta 22fi men died, and of these deaths upwards of one-half were caused by disease contracted in Upper India.](https://iiif.wellcomecollection.org/image/b28038344_0074.jp2/full/800%2C/0/default.jpg)