Age and length of service as affecting the sickness and mortality of the European army : and aggregate of the statistics of the army for the ten-year period, 1860-69 / by James L Bryden.
- Bryden, James L. (James Lumsdaine), 1833-1880.
- Date:
- 1874
Licence: Public Domain Mark
Credit: Age and length of service as affecting the sickness and mortality of the European army : and aggregate of the statistics of the army for the ten-year period, 1860-69 / by James L Bryden. Source: Wellcome Collection.
Provider: This material has been provided by Royal College of Physicians, London. The original may be consulted at Royal College of Physicians, London.
76/82
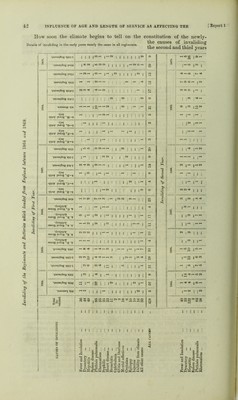
![NEWLY-ARRIVED REGIMENTS IN THE SECOND YEAR OF SERVICE, 18G5—70. {Conthmalion of the Statistics of the hody represented in the preceding Table ; this Table is to be studied in contrast with that tvhich yrrecedes.) Months. < 1 1 Average Number Daily Sick. 1 1 O i i» a s /C, ; Number of Deaths. Died per 1,000 of Strength.* Cacses or Deaths. Cholera. j Small pox. Fever, Intermittent. Fever, Remittent and j Continued. ! Apoplexy. | Delirium Tremens. j Dysentery. 1 Diarrhoea. Hepatitis Spleen Disease. Respiratory Diseases. Heart Diseases. Fhthisis I’ulmonalis. Dropsy. Scurvy. Atrophy and Anajmia. i s < rs m 0 Suicide. All other Causes. Jamtnry 11,495 1 794 54-8 19 1-31 2 ■ 4 ! 1 1 I ... 1 1 1 i I 3 3 1 February 14,478 777 53-7 7 •48 l 2 1 ] 1 1 March 14,710 757 51-5 10 •61 1 ”l i ■’: 1 '1 1 1 1 4 April 14,621 851 58-2 38 2-39 I 3 1 ‘7 I 2 4 ’2 8 2 1 2 1 1 14,570 993 68T 36 1-37 : 7 1 3 4 1 3 ' T ... i June 14,475 1,015 70 1 28 1-93 1 1 3 11 1 i 1 2 ’ 1 ! 3 ' 1 1| *‘‘2 •Tuly 14,439 1,000 69 3 25 1-66 * 1 1 5 1 li j i 3: '2' 2 1 August 14,426 1,026 71T 56 236 22 10 6 1 3 2 4 1 ... 2 1! 2 September 14,312 1,161 81-1 47 3-00 4 13 1, 1 6 1 7 1 2 5 1, i| F 8 October 11,344 1,161 80-9 4-s 2-86| 1 12 2 2I 10 1 2 4 ...! ii 1 2 November 14,081 944 67-0 29 2-06 6 4 7 1 3 '1 2i 2 3 December 11,123 679 48T, 18j 1 27j 2 1 F 1 1 1 1 4 ... 2 2| 3 i 1 48 5 5 70 j 6 1 28 i 48 ~l ...j 9 18 31 1 1 1 - 15 1 22 1 Died per 1,000 of the Average Strength. For the year 14,423 i 930: 355 24-61! 1 3-33| •35 5-20 ! 1 2-01 j 194 •48 1 “'1 1 1 1 1-25 i 215 1 1 •07 •28 l-04j 1’52 Causes of Admissions. Number of Admissions into Hospital in each Month Total Admitted Admitted per 1,000 of Strength. Died out of each hundred treated. 1 .fan. Feb. Mar. April. ' May. .lune. .Tuly. Aug. Sept. ! Oct. Nov. Dec. 1 during |the Year. Cholera 1 2 i 19 i 3 29 1 4 i 1 1 1 6.5 i 4-5 73-85 Small pox 11 3 6 4 i 2 2 1 1 - 28 ' 2-0 17-86 Fever, Intermittent 144 ! 95 118 114 i 122 175 1 203 328 744 ! 1,100 1,321 522 4,986t 345-7t •10 „ Remittent and Con- 1 i tinued 45 46 i 99 316 I 567 671 417 522 314 j 250 115 67 3,429 i 237-7 2-04 Apopdexy 2 4 6 26 i 11 13 1 3 1 67 4-6 43-28 Delirium Tremens ’s 4 j 2 10 11 6 2 3 13 1 7 ! ^ 5 77 5-3 7-79 Dysentery 46 20 1 34 67 1 71 52 1 44 112 96 ' 60 I 52 29 683 47-3 4-10 Diarrhoea •••! 73 51 51 161 1 120 101 j 118 220 127 113 76 55 1,269 88-0 •55 Hepatitis 43 35 1 71 56 76 66 i 70 75 82 76 66 40 756 52-4 6-35 Spleen Disease 2 2 I 1 3 1 9 3 6 4 3 1 35 2-4 Respiratory Diseases 127 72 80 81 100 98 62 83 80 74 61 75 993 689 •91 Fhthisis Fulraoualis 10 6 10 15 11 21 13 24 16 19 12 6 163 11-3 19-02 Scurvy 1 2 4 1 1 3 1 1 14 1-0 1 I Rheumatism ... 65 84 95 54 '73 66 85 85 88 68 77 63 903 1 62-6 1 Venereal Diseases 418 308 361 354 317 228 266 227 221 266 227 248 3,141 238-8 ! Eye Diseases ... 29 27 30 47 47 36 28 54 64 48 34 29 473 32 8 )• -69 Abscess and Ulcer ... j 123 1 1 105 129 141 178 170 153 141 101 96 75 1,.509 104-6 I Wounds and Accidents 114 109 135 93 101 77 72 77 79 82 87 68 1,094 75-9 I All other Causes 149 151 ( 205 181 234 284 i 250 279 249 221 175 143 2,521 174-8 J 1,408 11,113 1,413 1,693 2,021 2,089 1,826 2,288 2,326 1 2,493 2,409 j 1,427 22,506 1 Admitted | per 1,000 of the Average Strength in each Mouth. 97-1 76-9 96-1 115-8 138-7 144-3 126-5 1 158-6 162-5 173-8 171-1 j 101-0 1560-4 • In the monthly ratios Cholera is excluded. - t The high adinissiou*rate for fever in September, October and November is a local phenomenon, caused by the presence of Epidemic Malaria m the Punjab in 1869.](https://iiif.wellcomecollection.org/image/b28038344_0076.jp2/full/800%2C/0/default.jpg)