A geographical and statistical display of the locality, relation, superficies, and population of each county, section, district, and colony of the British Empire ... Russia, Prussia, France, the Netherlands, Germany, and the peninsula of Spain and Portugal, and the United States of North America, and China.
- John Marshall
- Date:
- [1833?]
Licence: Public Domain Mark
Credit: A geographical and statistical display of the locality, relation, superficies, and population of each county, section, district, and colony of the British Empire ... Russia, Prussia, France, the Netherlands, Germany, and the peninsula of Spain and Portugal, and the United States of North America, and China. Source: Wellcome Collection.
Provider: This material has been provided by The Royal College of Surgeons of England. The original may be consulted at The Royal College of Surgeons of England.
3/126 (page 2)
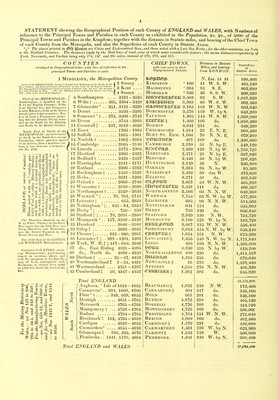
![SUMMARY of the 82 Pages 9- 90, shewing the proportion of the Population of GREAT BRITAIN ; engaged in, and dependant on, each great branch of Production and Occupation. The first Lord-Ellenborongh in fais place in parliament once slated thai there were upwards of 3,000,000 Persous in Great Britain, engaged in, and dependant on the Woolen Manufacture; the Edinburgh Review more recently asserted, that upwards of 1,000,000 Persous were so occupied and dependant; from the Statement below, it wilt be seen to he doubtful, whether in all its varied operations, more than 250,000 (certainly not 300,000) Persons, are engaged in, or dependant on that branch of industry similarly mistaken notions almost universally prevail, in regard t the greater or lesser extent and importance of each great branch of Production and occupation : in a work entitled “ Results of Machinery, published in 1831, under the superintendence of the Society for the Diffusion of Useful Knowledge, it is stated that “ in consequence of Machinery having rendered productions of all sorts cheaper, and therefore causing them to be more universally purchased, it has really increased the demand for manual labour, ” and in support of this assumption, at page 93, it is asserted that “ Richard Arkwright, a barber of Preston, invented in 1769, the principal part of the Machinery for spinning Cotton, and by so doing, he gave bread to about twomillionsf of People, instead of fifty thousand; ” and at page 106, in adverting lo the Silk Manufacture, it is further asserted that “ the higher pride of the present day, is, that we buy three millions and a half ponnds of Raw Silk from the Stranger, employ half a million f of our own people in the Manufacture of it, by the aid of Machinery, and seil it to the Stranger, and our own people at a price as low as that of the Calico of half a Century ago. In refutation of the false assumption and equally false assertion here set forth, the attention of the advocates and friends of truth is directed to the Analysis of occupations below ; at the period of 1769, and for 20 Years subsequent thereto, the habita- tions of Nos. 1-2 and 4-5, noted with an* were so many Manufacturing Establishments, earning on an average from 2/ to 6/ i? Week, which earnings supplied the means of domestic comfort and tended to social and moral order ;—the introduction of Machinery has concentrated the operation of Spinning with an imposing effect upon the minds of superficial thinkers, but it has annihilated the domestic operation, and deprived from 1,200,000 to 1,500,000 Families of the meant of comfort, and substituted in the habitations of the Farmers, mawkish pretensions for appropriateness of manner ; and in the cottages of the Labourer, recklessness of purpose for the social order which heretofore prevailed.—For the immoral effects which have fol lowed the introduction of Machinery and destruction of domestic industry,—see the Statement relating to Crime, which shews a progressive increase from 4,263 in 1806, to 19,647, in 1831. Districts of Production and Occupation. Numbers of Number of FAMILIES, as returned in 1821, i reference to the chiefly employed in Total N f s s * Nos. 4 and 6, include a considerable Number of Districts, umoer oj Manufacturers; but Nos. 13 and 17, ore the other ire the Trade, PERSONS, in iand include probably a greater Number engaged Topographical Manufactures all others TOTAL - 'a « in Mining, than Nos. 4 and 6 do in Manufacturing, Arrangement. or Handicraft 1821. 1831. 05 | fl Coal District of the North 1 — 09 3,318 30,076 20,441 53,835 235,525 277,662 18 2 Do Gloucester and Somerset 142 — 156 1,254 1,966 1,394 4,614 22,232 26,033 17 •s 3 Do Derby, Nottingham, Sfc, 339 — 350 1,606 2,639 819 5,064 25,756 30,761 20 ■» 4 Coal and Iron . . Warwick and Stafford 70 — 106 3,595 * 54,859 4,702 63,156 287,482 389,852 35 5 Do Leicester and Salop 113 — 126 1,318 6,591 1,302 9.211 43,200 47,166 9 6 Do. . . Sheffield, Rotherham, Sfc. 127 — ill 2,260 * 13,997 2,835 19,092 91,139 120,007 31J - 7 Do Monmouth and Brecon 157 — 206 2,203 9,745 2,213 14,161 74,684 108,488 45J 8 Tin, Copper, &c Cornwall 207 — 293 9,963 11,287 13,492 34,742 164,419 240,006 46 9 Copper, Lead, Slate, &c. .... Diverse 294 — 338 3,837 6,215 7,130 17,182 83,641 99,881 20 Total MINING DISTRICTS. 29,354 137,375 54,328 l 221,057 J 1,028,078 1,339,856 30 GO The Pottery 107— 112 296 6,696 1,023 8,015 39,107 49,643 27 11 Woollen District .. West of England 351 — 406 6,452 20,851 5,115 32,418 155,875 171,483 10 .2 12 Worsted, & Mixed Stuffs Norwich, Kendal 407 — 41.6 2,416 17,570 3,374 23,360 102,353 « 125,853 23 5 | 13 Woollen, Linen, &c. West R. of York 417 — 040 13,071 * 85,090 14,932 113,099 560,068 712,151 27 •jH 14 Hosiery Leicester, Notts., Derby, Sfc. 641 — 790 11,922 41,918 6,691 60,531 280,232 *2 339,264 21 ~ j 15 Silk Coventry, Congleton, Sfc. 791 — 835 3,176 15,876 1,176 20,228 95,328 U tl23,783 30 10 Salt Spring District Cheshire 836 — 859 1,115 2,670 1,178 4,963 23,956 +- 31,649 32 || 17 Cotton Lancashire, Sfc. 860 — 1270 j 21,701 * 163,046 18,690 203,443 1,042,125 fl,337,127 28J J8 Linen, Gloves, Silk, &c. W. of England 1271 — 1315 j 6,154 7,566 2,422 16,142 79,319 93,148 Total MANUFACTURING Districts. 66,303 361,289 54,607 482,199 2,378,363 2,984,101 25J The METROPOLIS,—see Page 15,455 208,234 122,885 346,574 ' 1,528,301 1,805,587 18 20 Sea Ports & Gt. Naval Stations Liverpool,be. 1316 — 1375 j 7,489 55,528 48,331 111,348 504,816 630,770 25 21 Places of Fashionable Resort Bath, Brighton 1376 — 1360 2,701 15,508 8,981 27,190 129,914 179,666 38£ 22 Minor Sea Ports, and Fishing Towns .. | 1361 — 1781 1 42,538 65,083 09,548 177,169 741,235 847,265 | \'± TOTAL 68,183 | 344,353 | 249,745 | 662,281 2,904,266 j 3,463,288 | 19 1782 — 4900 61,034 145,101 63,222 269,357 1,268,034] 24 Populous Parishes [specified 298,392 112,139 57,930 468,461 2,300,866 1 S3 25 Villages, exclusively Agricultural, not 324,691 59,721 5,659 390,071 2,099,268J 1 SFE'H'Lf opuIatioD, TOTAL 684,117 316,961 126,811 1,127,889 5,668,168 6,102,430 n Total ENGLAND and WALES. 847,957 | 1,159,975 485,491 2,493,423 11,978,875 13,889,675 16 do. SCOTLAND. 130,699 | 190,264 120,997 447,960 2,093,456 2,365,930 13 Total GREAT BRITAIN, in 1821. ] 1 Exclusive of 1 1 [ 978,656 1,350,239 612,488 2,941,383 14,072,331 16,255,605 151 do. do. 1831. J 1 Army Sf Navy, i t 1 The following STATEMENT shews the progressive increase of the Population in England, Wales, and Scotland, at each of the Six Ten Yearly Periods, since 1780 ; and the annexed State- ment shews the estimated proportion of the Popidation in 12 Classes, instead of under three heads only, as exhibited in the return made to Parliament. Notwithstanding, the prevailing notion of Manufacturing, being the predominating interest qf Great Britain; by these Analyses of the Population, it is seen, that five-sixths ojf the Number are dependant on Agriculture for subsistence. Years Army Sp Ny.\ England Wales Scotland j Great Britain j 1 Ireland 1781 91 1801 11 21 31 250.000 200.000 470,958 640,500 319,300 I 277,017 ' 7.473.000 8.175.000 8,331,430 9,538,830 1 11,261,437 ' 13,089,338 480.000 500.000 541,540 611,785 717,438 805,236 1.470.000 1.500.000 1,599,208 1 1,805,688 2,013,459 2,305,007 1 9,673.000 10,105,000 10,942,646 12,596,803 14,391,631 | 10,537,398 i No accurate Return, prior lo 1621. 6,002,093 7,734,365 Analysis of OCCUPATIONS. — Number of FAMILIES, in Total Number of PERSONS 1831. 1821. 1831. 1 Agricultural Occupiers * 250,000 250,000 1,500,000 2 do. Laborers * 728,956 800,000 4,800,000 3 Mining do 110,000 120,000 600,000 4 Millers, Bakers, Butch. * 160,000 180,000 900,000 5 Artificers, Builders, &c. * 200,000 230,000 650,000 6 Manufacturers ........ 340,000 400,000 2,400,000 7 Tailors, Shoema.,&Flat. 150,000 180,000 1,080,000 8 Shopkeepers 310,239 350,000 2,100,000 9 Seamen and Soldiers .. 319,300 1 277,017 831,000 10 Clerical, Legal, & Medl. 80,000 90,000 450,000 11 Disabled Paupers .... 100,000 | 110,000 110,000 12 Proprietors, Annuitants 192,888 1 | 316,48? 1,116,398 TOTALS. 2,941,383 1 i 3,303,504 16,537,398](https://iiif.wellcomecollection.org/image/b22297030_0005.jp2/full/800%2C/0/default.jpg)