A geographical and statistical display of the locality, relation, superficies, and population of each county, section, district, and colony of the British Empire ... Russia, Prussia, France, the Netherlands, Germany, and the peninsula of Spain and Portugal, and the United States of North America, and China.
- John Marshall
- Date:
- [1833?]
Licence: Public Domain Mark
Credit: A geographical and statistical display of the locality, relation, superficies, and population of each county, section, district, and colony of the British Empire ... Russia, Prussia, France, the Netherlands, Germany, and the peninsula of Spain and Portugal, and the United States of North America, and China. Source: Wellcome Collection.
Provider: This material has been provided by The Royal College of Surgeons of England. The original may be consulted at The Royal College of Surgeons of England.
6/126
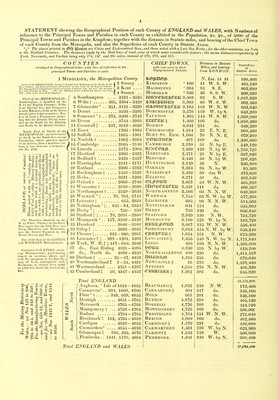
![6 STATEMENT of the Superficies, in Statute Acres, of each County of England and Wales, shewing the proportion of each County, in a state of Tillage, in Pasture, and in Wood, Unproductive, |-c.. The Rental of each County, according to the Property Tax Returns of 1815, together with the average Rate ^ Acre of the entire Superficies, the amount of the Parochial Assessments, and of the Land and Assessed Taxes, in each County, in 1829. The proportions in a state of Tillage, Pasture, Sfc., does not profess to be founded on any very accurate data. The Total Superficies of York is 3,815,040 Arm, but the subdivision of the three Ridings is probably not accurate COUNTIES Superficies in Statute Acres, deduced from the arranged in Order of their Trignometical Survey. Rentals TOTAL SUPERFICIES, Proportions in a state of according to with Number of reference to their i Wood,unpro- TOTAL Property Tax Topographical Position. Tillage Pasture ductive, 8yC. Superficies Return of 1815, £ 1 Lincoln 16 400,000 1,100,000 258,720 1,758,720 1,581,940 2 Devon 10 400,000 800,000 450,560 1,650,560 1,217,547 3 York, West Riding 36 350,000 700,000 518,000 1,658,000 1,555,608 4 Norfolk 14 730,000 263,000 345,880 1,338,880 931,842 5 York, North Riding .... 38 273,000 596,000 442,180 1,337,820 1,053,010 6 Northumberland 40 150,000 650,000 397,440 1,197,440 906,789 7 Lancaster 35 450,000 350,000 371,840 1,171,840 1,270,344 8 Somerset 9 330,000 524,000 196,080 1,050,080 1,335,108 9 Southampton 5 380,000 620,000 41,920 1,041,920 594,020 10 Kent 3 400,000 200,000 383,680 983,680 868,138 11 Essex 12 380,000 520,000 80,480 980,480 904,715 12 Suffolk 13 250,000 500,000 229,200 967,680 694,078 14 Sussex 4 280,000 345,000 311,330 936,320 549,950 15 Wilts 6 150,000 250,000 482,560 882,560 810,627 10 Salop 33 300,000 500,000 58,240 858,240 738,495 17 Cornwall ]1 250,000 255,000 344,280 849,280 566,472 18 Y ork, East Riding 36 150,000 350,000 319,220 819,220 500,000 19 Gloucester 7 300,000 450,000 53,840 803,840 805,138 20 Stafford 30 500,000 100,000 134,720 734,720 756,635 21 Durham 39 100,000 200,000 379,040 679,040 506,063 22 Chester 34 200,000 450,000 23,280 673,280 676,864 23 Derby 29 100,000 400,000 156,640 656,640 621,693 24 Northampton 25 290,000 235,000 123,880 650,880 696,637 25 Dorset 8 250,000 330,000 63,200 643,200 489,025 20 W arwick 26 200,000 308,000 69,280 577,280 645,139 27 .Hereford 32 300,000 250,000 6,400 550,400 453,607 28 Cambridge 15 140,000 160,000 249,120 549,120 453,255 29 Nottingham 28 200,000 100,000 235,680 535,680 534,992 30 Leicester 27 65,000 450,000 514,560 702,402 31 Westmoreland 41 30,000 130,000 328,320 488,320 221,556 32 Oxford 23 150,000 230,000 105,280 481,280 497,625 33 Berks .. 22 260,000 120,000 103,840 483,840 405,! 50 34 Surrey 2 80,000 400,000 5,120 485,120 369,901 35 Buckingham 21 253,000 170,000 50,600 473,600 498,677 36 Worcester 24 200,000 150,000 116,560 466,560 516,203 37 Hertford 17 225,000 50,000 62,920 337,920 342,350 38 Monmouth 31 100,000 155,000 63,720 318,720 203,576 39 Bedford 18 40,000 168,000 88,320 296,320 272,621 40 Huntingdon 19 100,000 60,000 76,800 236,800 202,076 41 Middlesex 1 43,000 100,000 37,480 180,480 349,142 dO. Rllt.la.nrt 20 95,360 99,174 TOTAL England 9,749,000 13,689,000 8,806,940 32,332,400 27,890,358 P A n p'l esea. 173,440 75,936 * Carnarvon 100,000 148,160 100,000 348,160 96,621 ^ ! b J Denbigh 150,000 250,000 5,120 405,120 237,182 .© ^ Flint 20,000 110,000 26,160 156,160 131,504 Merioneth 50,000 300,000 74,320 424,320 93,250 [.Montgomery 60,000 180,000 296,960 536,960 180,320 f Brecon 50,000 246,960 185,600 482,560 131,307 | Cardigan 100,000 145,000 18,700 432,0.00 107,169 U | Carmarthen 114,000 228,000 281,360 623,360 229,689 % ] | Glamorgan 43,000 262,000 201,880 506,880 220,219 Pembroke 140,000 160,000 90,400 390,400 168,665 1 L_Radnor 85,000 150,000 37,640 272,640 88,617 £ £ Parochial Land and <§®,l. Assessments Assessed for the Year TAXES, ending the 25th. in the Year of March 1829. 1829. £ 18/0 228,976 118,904 14/9 245,045 137,941 18/9 345,370 *109,576 13/11 308,565 141,623 15/9J 103,513 65,498 15/11 84,884 82,515 21/8 398,743 184,583 25/5 190,202 202,860 11/5 219,978 109,368 17/7J 384,143 178,454 18/51 303,237 133,422 14/2 273,266 111,022 9/11 57,888 23,243 11/9 267,459 116,321 18/41 199,214 80,958 17/2.J 90,557 66,487 13/4 118,629 48,647 123,617 89,305 20/04 204,325 126,357 20/7 155,649 76,451 14/11 98,996 wilh No,lh„»b.,U 20/1 137,887 66,254 18/11 103,706 51,830 21/54 160,089 81,324 15/24 96,544 57,544 22/4 161,512 95,633 16/4 68,943 37,030 16/6 111,497 54,293 20/0 94,471 59,543 27/31 129,897 61,953 9/1 30,738 45,684 20/6 139,992 60,448 16/9 125,416 71,288 15/44 292,256 272,538 21/04 146,543 56,807 22/14 94,107 69,166 20/3 107,436 66,726 12/9 31,837 41,050 18/5 86,949 35,662 17/1 48,941 24,003 38/9 740,778 1,340,643 28/10 12,667 with Nortfcampto» 17/3 7,330,461 4,865,191 8/9 19.486' ) 5/64 23,188 11/84 39,730 16/10 24,300 4/5 10,613 5/81 29,062 39,226 5/5 4 0/24 20,228 20,261 20,672 25,021 7/44 36,988 8/8 40,299 with Monmouth 8/74 27,087 6/6 | 14,468^ 1](https://iiif.wellcomecollection.org/image/b22297030_0008.jp2/full/800%2C/0/default.jpg)