[Report 1954] / Medical Officer of Health, Oxford City.
- Oxford (England). City Council. no2012034102.
- Date:
- 1954
Licence: Attribution 4.0 International (CC BY 4.0)
Credit: [Report 1954] / Medical Officer of Health, Oxford City. Source: Wellcome Collection.
25/164 page 25
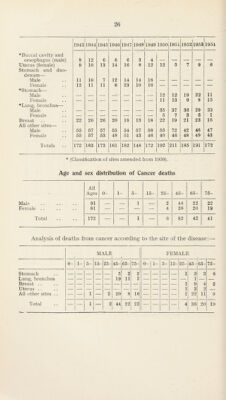
![DEATHS FROM TUBERCULOSIS Years 1935—1954 Pulmonary Non-Pulmo]' ^ARY 0- 1- 5- 15- 45- 65- Total 0- 1- 5- 15- 45- 65- Total 1935 1 1 2 30 12 6 51 _ 2 2 1 1 6 1936 — — — 23 18 3 44 1 2 2 2 1 — 8 1937 — — — 29 23 1 53 — 4 1 4 1 1 11 1938 — — — 26 17 4 48 1 2 1 5 — -- 9 1939 — 1 1 24 13 3 42 — 2 3 3 — — 8 1940 — — — 36 10 — 46 1 2 — 4 1 — 8 1941 1 —- — 27 17 3 48 — 3 — 5 — 1 9 1942 1 1 2 24 27 3 68 1 — 1 4 1 1 8 1943 1 --- — 22 14 7 44 — 1 1 6 — 1 9 1944 1 1 — 25 9 4 40 — 1 2 2 2 — 7 1946 1 ■—- — 22 9 5 37 — — — 4 2 — 6 1946 — — — 16 10 2 28 1 3 1 4 3 1 13 1947 — _ 1 25 10 3 39 --- — — 3 2 — 5 1948 — — — 24 8 4 36 _—- _ 1 1 3 1 6 1949 — --- -- 11 4 9 24 --- 1 _—. 2 --- 1 4 1950 — — 1 7 9 6 23 — — 1 1 3 — 6 1951 — — — 3 14 7 24 — 1 — 2 1 1 5 1952 — — 1 4 6 — 11 — 1 — 1 1 1 4 1953 — — — 5 8 7 20 — -- — 1 1 — O 1954 I 3 4 7 1 1 The following table shows the distribution of the infant deaths and stillbirths during 1954 (excluding inward transfers). Ward Estimated Population Infant J Number dortality Rate Stillbirths Number j Rate A. Summertown and Wolver- cote 12,541 2 11.83 4 23.12 B. North 10,130 3 25.86 1 8.55 C. West 10,202 3 24.59 6 39.37 D. South 10,034 2 16.38 2 15.16 E. East. 14,849 6 32.97 — — F. Headington and Marston 24,019 10 27.62 9 24.26 G. Cowley and Iffiey 25,125 7 23.89 4 13.47 106,900 33 24.02 25 17.87 The following table shows the deaths from cancer under various headings for the last twelve years:—](https://iiif.wellcomecollection.org/image/b29942573_0025.jp2/full/800%2C/0/default.jpg)