[Report 1910] / Medical Officer of Health, Tynemouth County Borough.
- Tynemouth (England). County Borough Council.
- Date:
- 1910
Licence: Attribution 4.0 International (CC BY 4.0)
Credit: [Report 1910] / Medical Officer of Health, Tynemouth County Borough. Source: Wellcome Collection.
11/98 (page 13)
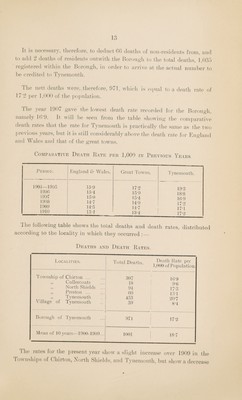
![1 Q lo It is necessary, therefore, to deduct 66 deaths of 11011-residents from, and to add 2 deaths of residents outwith the Borough to the total deaths, 1,035 registered within the Borough, in order to arrive at the actual number to be credited to Tynemouth. The nett deaths were, therefore, 971, which is equal to a death rate of 1 7‘2 per 1,000 of the population. The year 1907 gave the lowest death rate recorded for the Borough namely 16 9. It will he seen from the table showing’ the comparative 3 e louth is practically the same as the two previous years, but it is still considerably above the death rate for England and Wales and that of the great towns. Comparative Death Bate pee 1,009 in Previous Years. Period. England & Wales. Great Towns. Tynemouth. 1901—1905 15-9 17-2 19-3 1906 15-4 15-9 18-8 1907 15-0 15-4 16-9 1908 14-7 14-9 17-2 1909 14-5 14-7 17*] 1910 13-4 13-4 17-2 ihe following table shows the total deaths and death, rates, distributed accordiug to the locality in which they occurred :_ Deaths and Death Bates. Total Deaths. Death Rate per 1,000 of Population. 307 16*9 18 9-6 94 17-3 60 13-1 453 207 39 8-4 971 17 2 1001 18-7 Localities. Township of Chirton ... Cullercoats North Shields Preston ... Tynemouth Village of Tynemouth 5) > > 5? Borough of Tynemouth Mean of 10 years—1900-1909. The rates for the present year show a slight increase over 1909 in the Townships of Chirton, North Shields, and Tynemouth, but show a decrease](https://iiif.wellcomecollection.org/image/b30198720_0011.jp2/full/800%2C/0/default.jpg)