[Report 1913] / Medical Officer of Health, Darlington County Borough.
- Darlington (England). County Borough Council.
- Date:
- 1913
Licence: Attribution 4.0 International (CC BY 4.0)
Credit: [Report 1913] / Medical Officer of Health, Darlington County Borough. Source: Wellcome Collection.
8/82 page 8
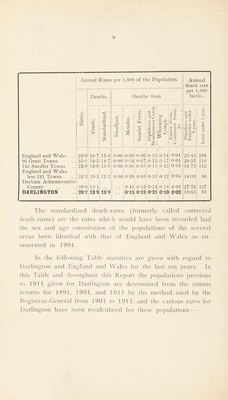
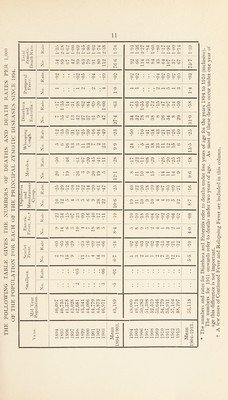
![Annual Rates per 1,000 of the Population. Annual death rate per 1,000 Deaths. Deaths from births. C/5 ^ O u ^ <v 1- > ^ (i; u ''6 r~j <V N X (A > <v To t£ r~' . 0; ii, P '“C « OJ O C/} ni tn ♦ U rj ^ u P c/D rt a; p c3 3 r— r- u: QJ <4^ 3 o ^ a ^ i:: o ^ Urn r-J ■1) c: -4-J t:-r: ^ CO U 5 ctj CD Ui o O u H England and Wales .. 23-9 13-7 13-4 0-00 0-28 0-06 0T2 0T4 0-04 23-41 109 96 Great Towns 25-1 14*3 14-7 0-00 0-34 0-07 013 0T7 0-04 29-33 116 14-5 Smaller Towns 23-9 12-8 130 0-00 0-30 0 05 0-11 0-13 0-05 24-73 112 England and Wales less 241 Towns 22-3 13*1 12-1 0-00 0-20 0-05 0-11 0-12 0'04 14-39 96 Durbam Administrative County 30-6 15-1 , , 0-41 OTo 0-19 0-18 0'06 27-76 137 DARLINGTON 26*7 139 13-9 • • 0*15 i 0*12 0*21 0*10 0*02 18-65 93 The standardized death-rates (formerly called corrected death-rates) are the rates which would have been recorded had the sex and age constitution of the populations of the several areas been identical with that of England and Wales as en - Limerated in 1901. In the following Table statistics are given with regard to Darlington and England and Wales for the last ten years. In this Table and throughout this Report the populations previous to 1911 given for Darlington are determined from the census returns for 1891, 1901, and 1911 by the method used by the Registrar-Genera] from 1901 to 1911, and the various rates for Darlington have been recalculated for these populations: —](https://iiif.wellcomecollection.org/image/b29582052_0008.jp2/full/800%2C/0/default.jpg)